PG Procter & Gamble Earnings per share increase in current year
The Procter & Gamble (PG) faces inflationary pressure and competition from private labels while optimizing costs through the outsourcing of logistics and packaging. This chart in the GURU.Markets terminal illustrates the annual EPS growth, where 1.30 serves as the current parameter value, visualizing the impact of these factors on profitability. An impeccable brand image ensures business resilience and long-term investor optimism.

Financial and market metric breakdowns for pginvestor.com (PG)
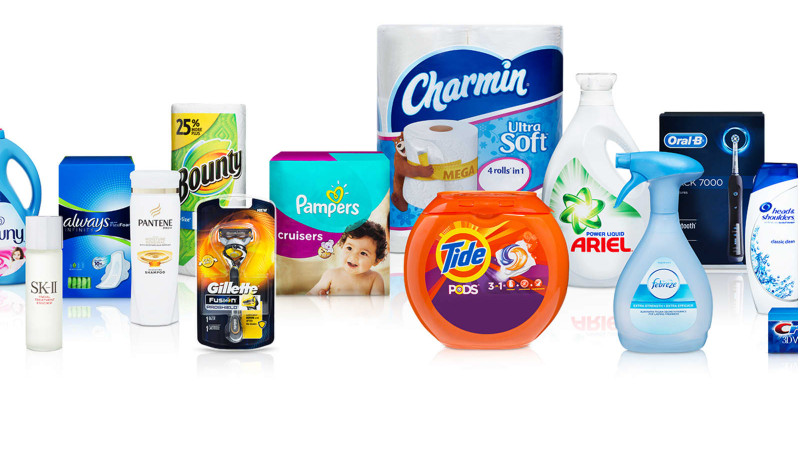
The Procter & Gamble (PG) premium portfolio enables the company to effectively pass inflation onto consumers through product pricing, although the current year-over-year EPS comparison reflects the impact of consumers switching to budget alternatives. This indicator measures the annual growth of earnings per share, allowing investors to assess value generation efficiency and promptly identify any stagnation in the business model relative to market leaders.
