PRE Prenetics: Market Capitalization to Book Value Ratio

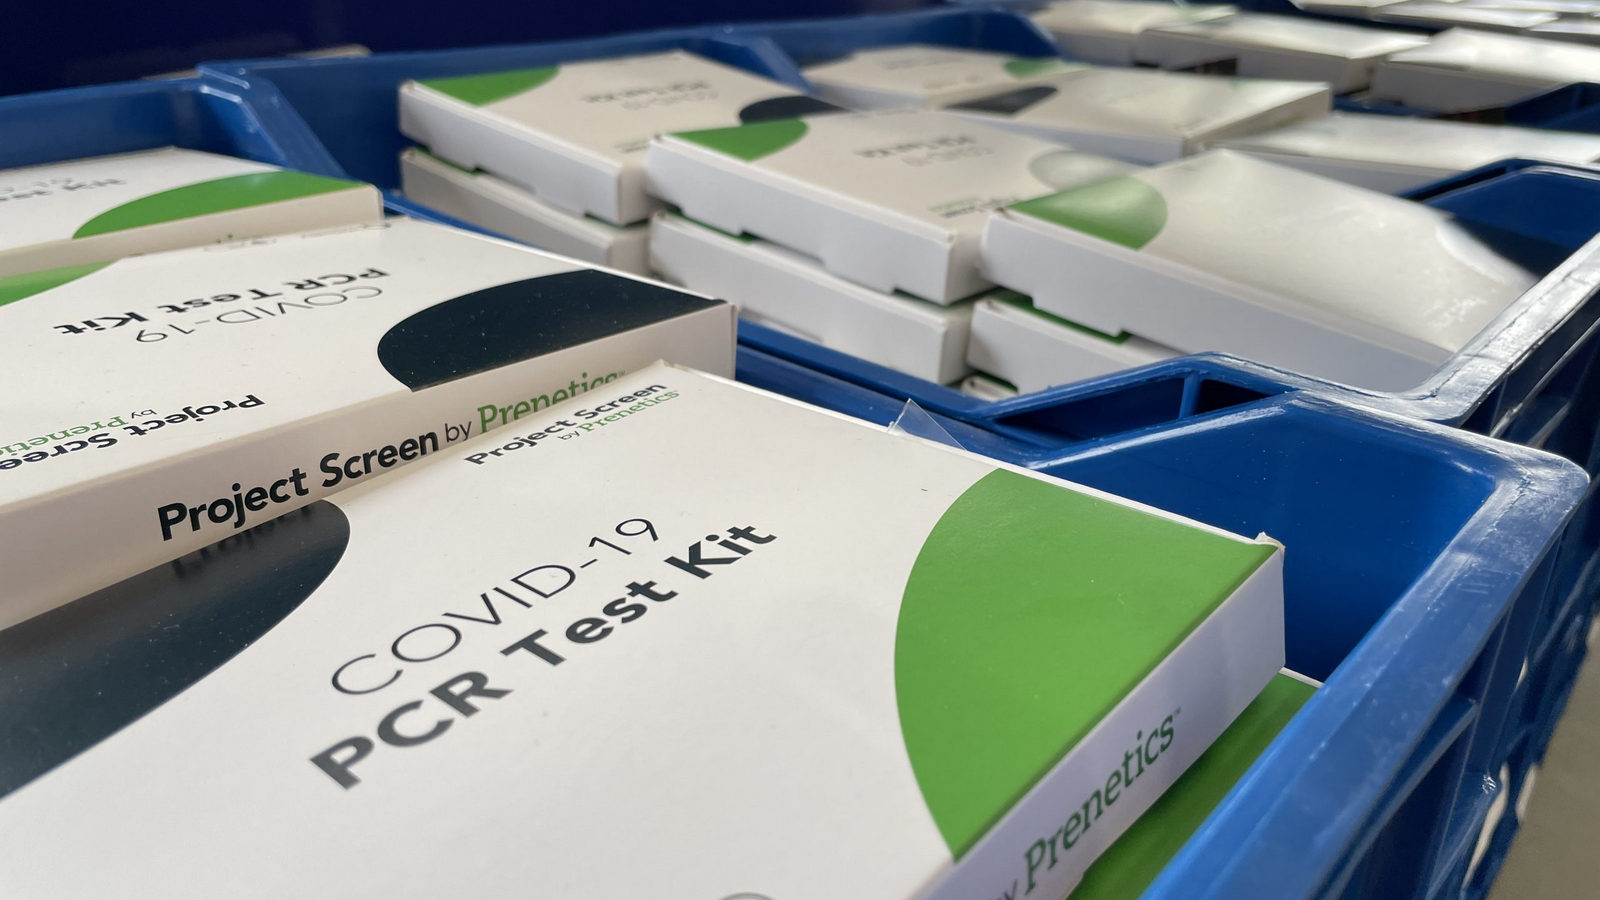
This daily price chart for Prenetics Global (PRE) illustrates the quotes for the preventive diagnostics provider, where the indicator stands at 3.33. The business relies on robotic DNA sequencing, which minimizes costs as volumes scale. Growth is driven by the Asian market and the integration of CircleDNA into insurance. A flawless image as an innovator in cancer screening ensures high user confidence in the accuracy of the tests.

PRE (Prenetics Global): analytical breakdowns and indicator data
This ratio compares the market value of shares with net assets, determining the premium or discount to real capital and the market's level of confidence in asset quality. By analyzing the P/BV chart for Prenetics Global (PRE), an investor can assess the impact of reporting digitalization and environmental responsibility on capitalization, identifying hidden value degradation or the resilience of the business model.