PAM Transportation Services (PTSI) - Net earnings per one share growth for the current year

The year-over-year percentage change in earnings per share demonstrates P.A.M. Transportation Services (PTSI) dependence on driver retention and order volume. The -89.00 level is a current metric reflecting fierce pricing battles within the overland transportation segment. Declining efficiency is driven by high fleet maintenance costs amid falling market rates, which limits the overall profitability of the business.

Financial and market metric breakdowns for P.A.M. Transportation Services (PTSI)
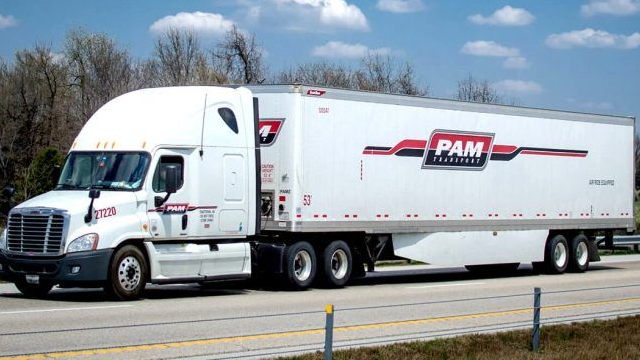
Earnings per share dynamics reflect operational efficiency through the annual percentage change in net income. This year-over-year growth in earnings per share is calculated daily, eliminating time gaps between quarterly reports to capture the business's real trajectory. The stable image of P.A.M. Transportation Services (PTSI) as a reliable industrial carrier confirms the resilience of this metric, allowing investors to timely recognize the risk of overpaying when buying at the peak.
