QUAD - Quad Graphics P/S Multiple

Symbol and logo of brand Quad (QUAD)

Quad/Graphics, Inc. (QUAD) is facing a reduction in its printing staff while simultaneously strengthening its team of data analysts. The enterprise value-to-revenue ratio reflects the current market valuation, where the value 0.10 serves as the baseline metric. This B2B printing segment leader is expanding its reach through digital marketing, and management's strategy of cost optimization and IT solution implementation is creating a foundation for long-term capitalization growth.

P/S Multiple: Quad Graphics (QUAD) for 07/04/2022 - 11/13/2026

Metric breakdowns and analytics for Quad (QUAD)
- market value and analyst target forecast:
- market capitalization statistics:
General company analysis:QUAD quad.com
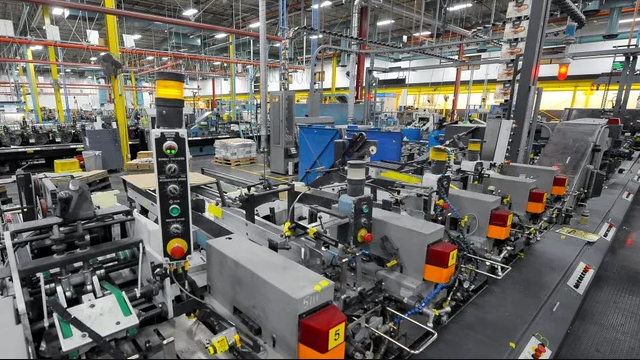
Manufactured product of Quad/Graphics Corp

The P/S ratio determines the market value of a business per unit of revenue generated, allowing investors to differentiate fundamental sales growth from purely speculative pressure on quotes. An analysis of the price-to-sales ratio dynamics for Quad/Graphics, Inc. (QUAD) confirms the stability of the company's valuation, which is supported by the long-term commitments of global retailers and the steady operation of large-scale printing capacities.

Competitors of Quad/Graphics, Inc.

thetradedesk.com (TTD) - Price-to-Revenue Multiple|Omnicom - Market Cap to Revenue|P/S Multiple Lamar LAMR|Interpublic Group of Companies - P/S Multiple|WPP - P/S Multiple|MGNI: P/S Multiple|Market Cap to Revenue Ratio OUT|DV (DoubleVerify Holdings, Inc.) - P/S Multiple|QMMM - Price-to-Revenue Multiple|Price-to-Revenue Ratio Vistaprint (CMPR)|IAS (integralads.com) - Market Capitalization-to-Revenue Ratio|P/S Multiple STGW (Stagwell Inc.)|P/S Multiple criteo.com CRTO|SEMR - Price-to-Revenue Ratio|Price-to-Sales Ratio TBLA|EEX: P/S Multiple|QuinStreet Media - Market Capitalization-to-Revenue Ratio|IBTA (Ibotta, Inc.) - P/S Multiple|clearchanneloutdoor.com (CCO) - Price-to-Revenue Coefficient|P/S Multiple ADV|Market Cap to Revenue Nexxen International Ltd. NEXN|Price-to-Revenue Ratio Viant Inc DSP|Price-to-Revenue Coefficient Fyber (APPS)|LZMH: Market Cap to Revenue|Market Capitalization-to-Revenue Ratio NCMI (ncm.com)|BOC: P/S Multiple|PUBM - Price-to-Revenue Coefficient|Price-to-Revenue Ratio Etoiles Capital|Market Cap to Revenue Ratio TEAD (Teads Inc.)|P/S Multiple TZUP|Market Cap to Revenue cardlytics.com CDLX|Fluent - Market Cap to Revenue|Price-to-Revenue Coefficient Phunware Inc. (PHUN)|ANTE - Price-to-Revenue Ratio|Price-to-Revenue Multiple Inuvo Corporation (INUV)|ABLV (Able View Global) - Market Cap to Revenue|wimiar.com (WIMI) - P/S Multiple|SCOR (Comscore) - P/S Multiple|P/S Multiple ViewBix, Inc.|P/S Multiple MCTR|Haoxi Health Technology Co., Ltd. - Market Cap to Revenue Ratio|P/S Multiple CREX (Creative Realities, Inc.)|P/S Multiple banzai.io BNZI|Direct Digital Holdings Inc. - P/S Multiple|INTJ (Intelligent Group Ltd.) - Market Cap to Revenue Ratio|CNET (zdat.com) - Market Cap to Revenue|BAOS (Baosheng Media Group Ltd) - Price-to-Revenue Ratio|STFS (Star Fashion Culture Holdings) - P/S Multiple|Price to Sales Everbright EDHL|Price-to-Revenue Ratio Smart Digital Group (SDM)|CAUD (Collective Audience Inc.) - Market Capitalization-to-Revenue Ratio|iClick - Market Cap to Revenue|Market Cap to Sales Volume MRIN (Marin Software Corp)|Starbox Group Holdings - P/S Multiple|Price-to-Revenue Coefficient innovid.com CTV