RDN (Radian) Quarterly Revenue Growth

The quarterly revenue growth rate demonstrates the business dynamics of Radian Group Inc. (RDN), where the value 106.30 describes the current level. Results depend on US housing prices and employment levels. A steady stream of premiums ensures predictability, although systemic crises may increase payouts. Rick Thornberry's professional management guarantees investors strict oversight of capital and risks.

Analytical breakdowns for Radian (RDN)
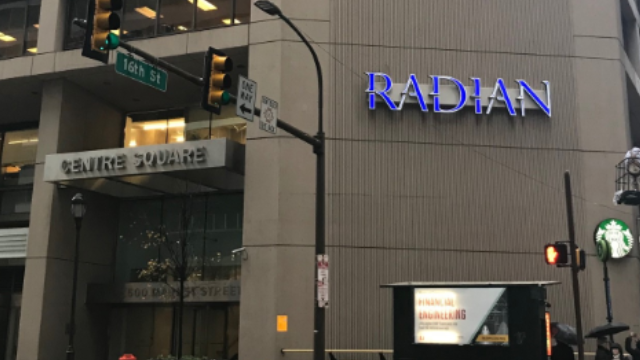
This indicator measures three-month sales dynamics on a daily basis, allowing for an assessment of business sensitivity to economic cycles through rhythmic revenue calculations. Analyzing quarterly revenue growth from sales helps investors track the impact of the US mortgage market and employment levels on the new insurance business volumes of Radian Group Inc. (RDN), revealing the correlation between the company's income and housing prices.
