Rambus Corporation (RMBS) - Forward Price-to-Revenue Multiple

Brandmark of Rambus (RMBS)

Rambus Inc. business is subject to market fluctuations and tied to data center investments. The company's forward P/S trend clearly demonstrates the volatility of investor sentiment, where 7.30 serves as the base parameter value. The fabless model makes the company dependent on Asian foundries, while the sale of intellectual licenses completely eliminates production risks for the issuer.

Rambus - RMBS Market Cap to Future Revenue Ratio (period 07/04/2022 - 11/13/2026)

RMBS (Rambus Corporation): analytical breakdowns and indicator data
- market price and analyst price targets:
Analysis of all company metrics:Rambus (RMBS)
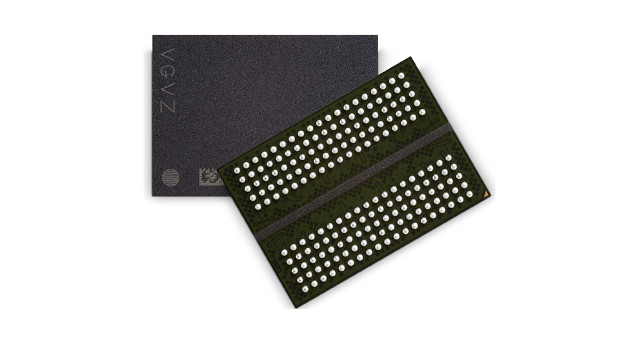
Product sample of Rambus Corporation

The efficiency of Rambus Inc. (RMBS) is based on capital-intensive developments by elite engineers and an aggressive patent strategy in microelectronics. The expected price-to-sales ratio digitizes market expectations for future sales, comparing current market capitalization with projected cash flow. This chart's price action allows for a determination of whether the current asset value results from an overvaluation of technological leadership or serves as a signal that the business is undervalued.

Competing companies

Price-to-Projected Revenue Ratio Broadcom AVGO|Forward Price to Sales AMD|TXN: Forward Price-to-Revenue Multiple|Forward Price to Sales ARM (Arm Holdings plc)|ADI: Forward P/S Multiple|Market Cap to Future Revenue Ratio intel.com (INTC)|Price-to-Projected Revenue Ratio Marvell|Price-to-Projected Revenue Ratio NXPI|Forward P/S Multiple ALAB|MCHP - Market Cap to Future Revenue Ratio|Forward P/S Multiple CRDO (Credo Technology)|STM - Forward Price-to-Revenue Multiple|ON: Forward Price-to-Revenue Multiple|Skyworks Solutions, Inc. - Price to Expected Revenue Ratio|MACOM Tech (MTSI) - Price-to-Projected Revenue Ratio|Lattice Corp - Forward Price to Sales|Price-to-Projected Revenue Ratio SiTime Corporation|Market Cap to Future Revenue Ratio littelfuse.com LFUS|Price-to-Projected Revenue Ratio Cirrus Logic (CRUS)|Impinj Inc - Market Cap to Projected Revenue|Forward P/S Multiple SMTC (Semtech Corp.)|Market Cap to Expected Sales Ratio Silicon Laboratories Corp (SLAB)|Ambarella, Inc. - Forward P/S Multiple|Silicon Motion Corp. (SIMO) - Forward Price-to-Revenue Multiple|Synaptics (SYNA) - Price-to-Projected Revenue Ratio|DIOD - Market Cap to Expected Sales Ratio|Price-to-Projected Revenue Ratio Power Integrations Corp|VICR: Forward Price to Sales|Forward P/S Multiple VSH|Forward P/S Multiple Himax Corp (HIMX)|Price-to-Projected Revenue Ratio Navitas Semiconductor Corporation NVTS|AOSL - Forward Price-to-Revenue Multiple|Ambiq - Forward P/S Multiple|CEVA: Price-to-Projected Revenue Ratio|WOLF (Wolfspeed, Inc.) - Forward Price-to-Revenue Multiple|arteris.com (AIP) - Forward P/S Multiple|Price-to-Projected Revenue Ratio Valens Semiconductor Ltd.|AXT Inc. (AXTI) - Market Cap to Expected Sales Ratio|Forward Price-to-Revenue Multiple MRAM (Everspin Technologies Inc.)|NA (Nano Labs Corp) - Forward Price to Sales|Forward P/S Multiple ATOM (Atomera Incorporated)|Market Cap to Expected Sales Ratio gsitechnology.com (GSIT)|GCTS - Price-to-Projected Revenue Ratio|MOBX (Mobix Labs Inc.) - Market Cap to Projected Revenue|PXLW: Forward P/S Multiple|Forward Price-to-Revenue Multiple Akoustis Technologies, Inc.|Forward Price-to-Revenue Multiple SGH|transphormusa.com (TGAN) - Market Cap to Expected Sales Ratio