SAGE - Sage Therapeutics Inc. Year-over-year net earnings per share growth for the last 12 months

High R&D costs and commercialization challenges for Sage Therapeutics, Inc. (SAGE) are driving the implementation of software robots for data analysis. The quarterly EPS growth marker visualizes this dependency, where the value 53.00 records the metric level. Strict adherence to pharmaceutical standards during the delivery of medications to medical centers and pharmacy chains completes the operating cycle.

Sage Therapeutics, Inc. (SAGE) - metric breakdowns and financial figures
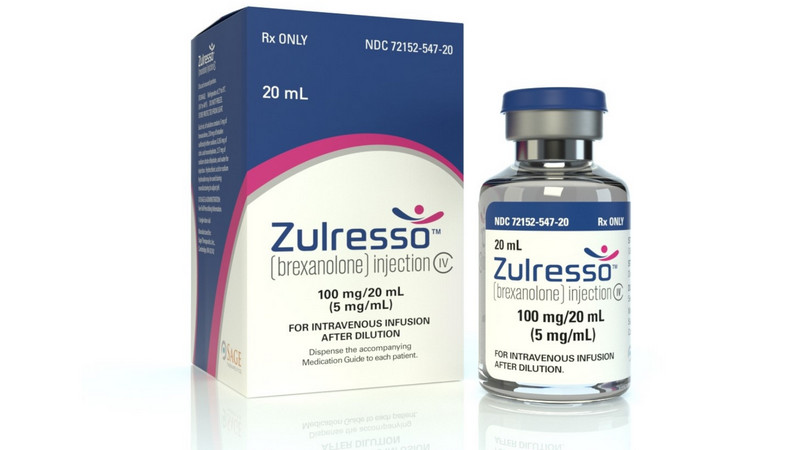
Sage Therapeutics, Inc. (SAGE) is advancing neuropharmaceuticals through strategic alliances with global behemoths to bring depression treatments to market. The earnings per share dynamics, reflected via the quarterly EPS growth rate, measure the rolling net income growth over three months, allowing investors to identify asset overheating in a timely manner and avoid premature conclusions between official reports.
