SENEA Seneca Foods Debt to Equity
Seneca Foods - graphic logo of issuer SENEA

Seneca Foods revenue is based on the mass production of canned vegetables for B2B and retail. The debt-to-equity ratio demonstrates financial stability, where 0.32 shows the value of this parameter. Sales stability is ensured by processing various crops under private labels. However, weak pricing power in the sector limits the ability to pass inflation onto the consumer.

SENEA: Seneca Foods Corporation Debt to Capital 07/04/2022 - 10/30/2026
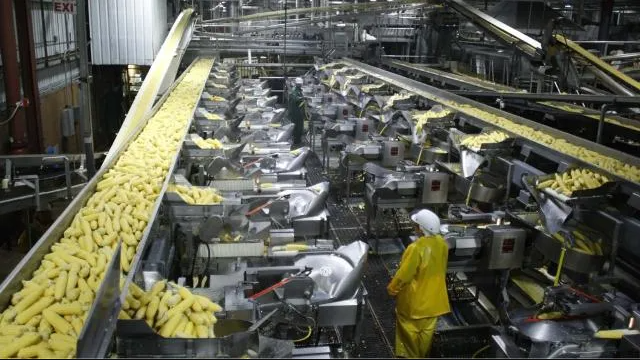
Finished products of senecafoods.com

The total leverage ratio determines the extent of a company's dependence on borrowed funds relative to its equity. This metric aggregates all liabilities and compares them against net shareholder assets. The trend in the ratio of total liabilities to shareholder equity reveals the balance between financial leverage and bankruptcy risk. For Seneca Foods (SENEA), this indicator is critical when scaling production. Debt control ensures the stability of its strategy to dominate the canned food market through cost minimization.

Who Seneca Foods competes with

KHC (Kraft Heinz) - Total Debt to Capital|Total Debt to Capital Kellogg Company|Debt to Equity General Mills Corp (GIS)|Total Debt to Capital Coefficient McCormick & Co., Inc.|Total Debt to Capital JBS (JBS S.A.)|hormelfoods.com (HRL) - Debt to Capital|SJM - Debt to Equity|Pilgrim's (PPC) - Total Debt to Equity Ratio|CPB: Total Debt to Capital|SFD - Total Debt to Capital Coefficient|Total Debt to Equity Ratio INGR|LW - Debt to Capital Ratio|Total Debt to Capital BRFS|POST: Aggregate Debt to Equity|Total Debt to Capital MZTI (T. Marzetti Company)|Total Debt to Capital Coefficient BellRing Brands Corp (BRBR)|TR - Debt to Equity|FLO (flowersfoods.com) - Debt to Equity Ratio|SMPL: Total Debt to Capital|NOMD - Total Debt to Capital Coefficient|Debt to Equity WK Kellogg Corp|J&J Snack Foods Inc (JJSF) - Total Debt to Capital Coefficient|Total Debt to Capital UTZ|THS (treehousefoods.com) - All Debt to Shareholders' Equity Ratio|Total Debt to Capital STKL (SunOpta)|Fisher Nuts (JBSS) - Debt to Capital|Lifeway Kefir - Total Debt to Capital|MAMA (Mama's Creations Corp) - Debt to Equity Ratio|BGS (B&G Foods, Inc.) - Total Debt to Equity Ratio|Beyond Meat - All Debt to Shareholders' Equity Ratio|HAIN (The Hain Celestial Group) - Total Debt to Capital|Bridgford Foods Corp. - Aggregate Debt to Equity|Debt to Equity Wing Yip Food (WYHG)|LSF - Debt to Capital|Debt to Equity Borealis Foods BRLS|Farmer Bros Co (FARM) - Debt to Capital|BranchOut Food Inc - Total Debt to Capital|PFAI (Pinnacle Food Group) - Debt to Equity Ratio|thisissowgood.com (SOWG) - Debt to Equity|TWG - Total Debt to Capital Coefficient|STKH (Steakholder Foods Ltd.) - Total Debt to Capital|Debt to Capital Blue Star Foods Corporation BSFC|Debt to Equity Whole Earth Brands (FREE)|Lancaster Colony Corp - Debt to Equity Ratio|Total Debt to Capital RGF (The Real Good Food Company)|Stryve Foods, Inc (SNAX) - Debt to Capital|Sovos Brands, Inc. - Total Debt to Capital