SGD - Safe and Green Development Corp Market Capitalization-to-Revenue Ratio
Localized facility procurement through internal partners minimizes port risks, as confirmed by the data snapshot on the GURU.Markets chart for Safe and Green Development (SGD). The current price-to-sales ratio demonstrates a trend where the actual value equals 0.20. However, the model relies on full construction outsourcing, creating a dependency on contractors. Additionally, rising material costs and mortgage rate volatility threaten profits.

Safe and Green Development (SGD) - metric breakdowns and financial figures
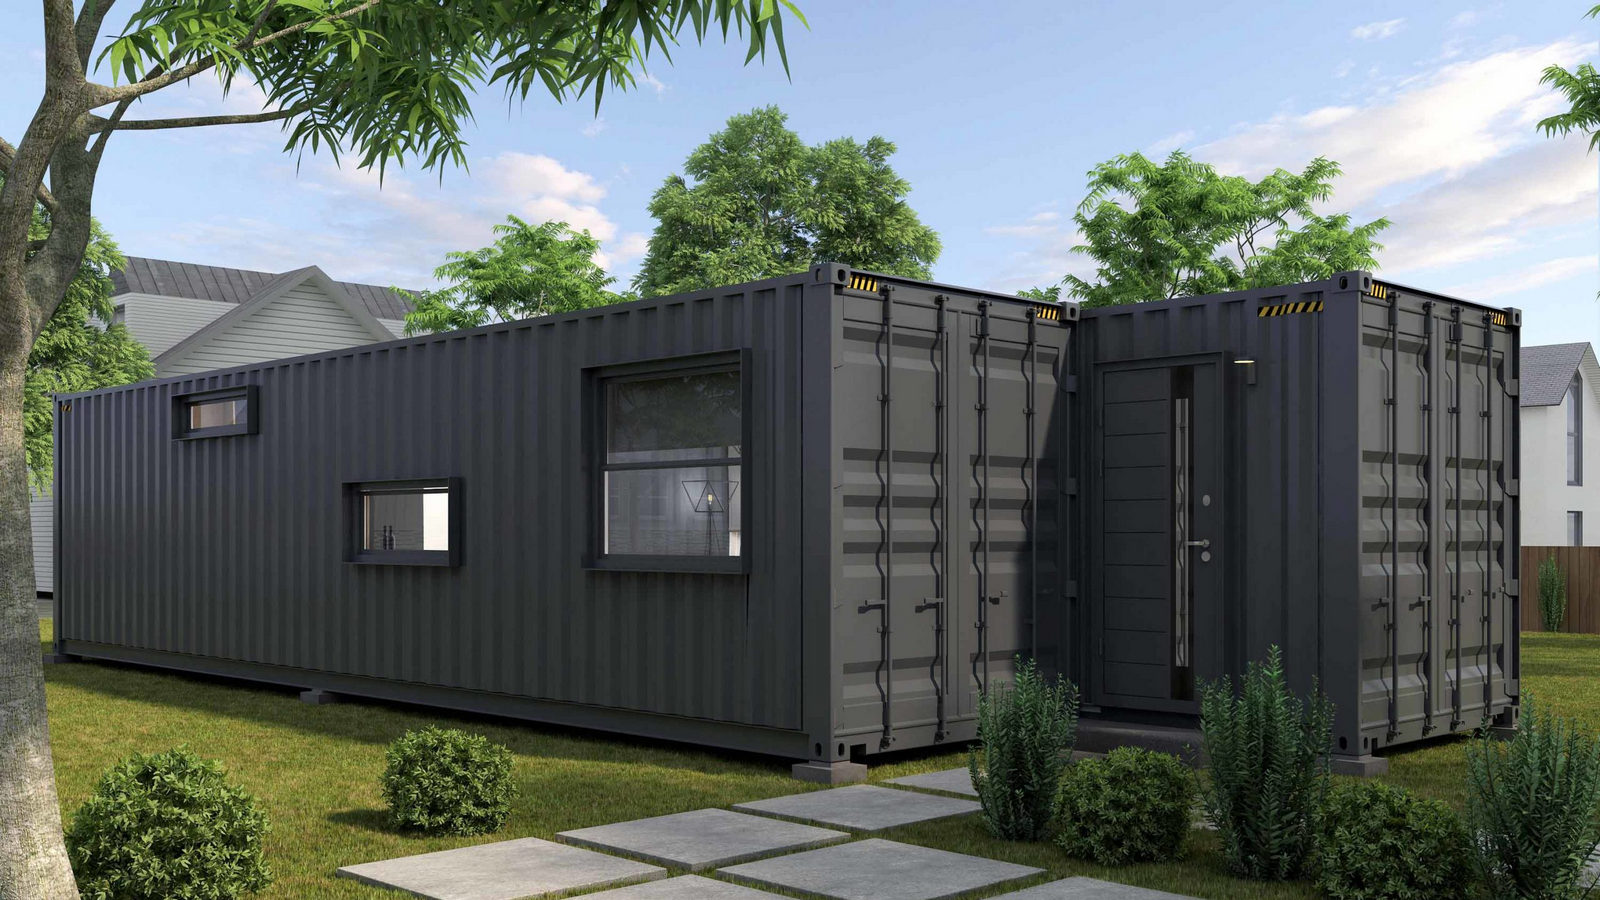
The P/S ratio reflects the market value of one dollar of revenue, allowing for an assessment of whether a business is overvalued or undervalued relative to its operational scale. By analyzing price-to-sales dynamics, an investor can gauge the sensitivity of market capitalization to sales volumes, which is critically important for Safe and Green Development (SGD) during its expansion via XMod modular construction and the growth of its residential development market share.
