SLCA - US Silica Price-to-Revenue Coefficient

Symbol and logo of brand U.S. Silica Holdings Inc. (SLCA)

U.S. Silica Holdings (SLCA) supplies quartz to the oil and gas sector and glass manufacturing, which drives the stock's price action. The enterprise value-to-revenue multiple visualizes this dependency, with the metric currently standing at 0.90. Revenues rely on hydraulic fracturing volumes and logistics costs, while stable management successfully diversifies supplies, smoothing out market volatility on the chart.

SLCA: U.S. Silica Price-to-Revenue Ratio 07/04/2022 - 08/10/2024

Metric breakdowns and analytics for U.S. Silica Holdings (SLCA)
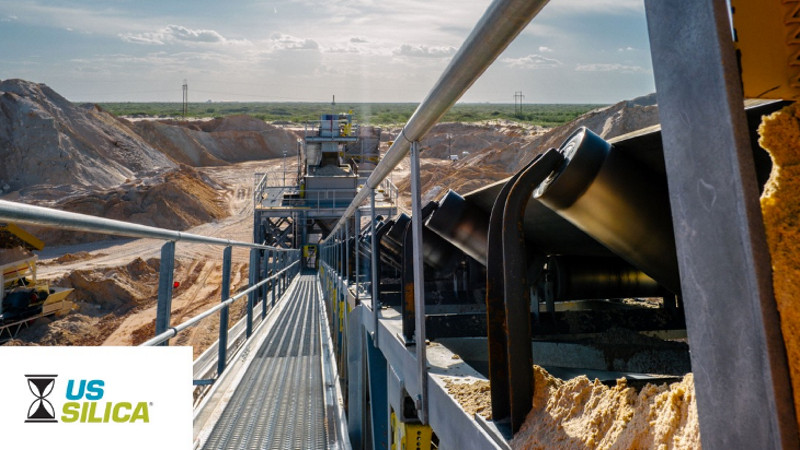
General company analysis:SLCA, U.S. Silica
Core merchandise of US Silica

The P/S multiple determines the market value of a business relative to its annual sales volume, allowing for an assessment of the asset's overvaluation regardless of current earnings. By analyzing the P/S multiple chart, an investor can identify overheating points for U.S. Silica Holdings (SLCA), taking into account the volatility of industrial sand demand in the oil and gas sector and the dependence of revenue on logistics costs and the construction market.

Competing companies

Linde - Market Cap to Revenue Ratio|Price-to-Revenue Ratio Air Products and Chemicals APD|Market Cap to Sales Volume DD (DuPont de Nemours, Inc.)|IP Corp - P/S Multiple|PPG (ppg.com) - Market Cap to Revenue Ratio|DOW: P/S Multiple|LYB (LyondellBasell Industries N.V.) - Price-to-Revenue Ratio|IFF (International Flavors & Fragrances) - P/S Multiple|Price to Sales RPM Group RPM|Price-to-Revenue Ratio entegris.com (ENTG)|Price-to-Revenue Coefficient Suzano S.A.|P/S Multiple WLK (Westlake Corp)|P/S Multiple Albemarle Corp ALB|ICL - Price-to-Revenue Ratio|Ethyl Corporation (NEU) - Market Cap to Revenue|eastman.com (EMN) - Price-to-Revenue Ratio|AXTA: Market Cap to Sales Volume|Market Cap to Revenue ESI|Market Cap to Revenue Sociedad Química y Minera de Chile (SQM)|Price-to-Revenue Ratio Celanese Corp. (CE)|Sensient Technologies Inc. - Market Cap to Revenue Ratio|P/S Multiple CBT (cabotcorp.com)|HWKN - Market Cap to Revenue|AVNT: Market Cap to Revenue|Price-to-Sales Ratio FUL|MEOH: P/S Multiple|Market Cap to Revenue WD-40 Corp|Price-to-Revenue Ratio Chemours|KWR: Market Capitalization-to-Revenue Ratio|P/S Multiple PCT|Market Cap to Revenue Ashland ASH|Price-to-Revenue Ratio ingevity.com NGVT|Market Capitalization-to-Revenue Ratio IOSP|MTX - Price-to-Revenue Ratio|DQ (dqsolar.com) - Market Cap to Revenue Ratio|Sylvamo (SLVM) - Price-to-Revenue Ratio|Huntsman Corp (HUN) - P/S Multiple|Price-to-Revenue Ratio Albany International|Market Cap to Revenue Ratio CLMT (Calumet Specialty Products)|P/S Multiple ROG|Market Cap to Sales Volume SCL|Price-to-Revenue Ratio Ecovyst ECVT|Price-to-Revenue Coefficient NeoGenomics Laboratories (NEO)|REX Corp - P/S Multiple|ASP Isotopes Corp (ASPI) - Market Cap to Revenue|TROX: P/S Multiple|Price-to-Sales Ratio GSM (Ferroglobe PLC)|Market Cap to Revenue WLKP|Price to Sales Compass Minerals International CMP|P/S Multiple KRO|Price-to-Revenue Coefficient SWM International|Price-to-Revenue Ratio LSB Industries, Inc. LXU|braskem.com.br (BAK) - Price to Sales|KOP: Market Cap to Revenue|ASIX - P/S Multiple|OEC (Orion Corp) - Market Cap to Revenue|Market Cap to Revenue Rayonier Advanced Materials Inc|Price-to-Revenue Ratio adurocleantech.com|P/S Multiple Magnera|Market Cap to Revenue CLW (Clearwater Paper Corp)|Tredegar - Market Cap to Revenue Ratio|Core Molding Technologies, Inc. - Market Cap to Revenue|FutureFuel Chemical Company (FF) - Price to Sales|flexiblesolutions.com - P/S Multiple|ALTO - P/S Multiple|FEAM (5E Boron) - Market Cap to Revenue|Price to Sales Trinseo S.A. (TSE)|ORGN (Origin Materials) - P/S Multiple|NTIC: Market Capitalization-to-Revenue Ratio|Market Cap to Revenue LNZA (LanzaTech Global Inc)|Market Cap to Sales Volume YMAT|P/S Multiple NUAI (New Era Helium)|Market Cap to Sales Volume BSLK (Bolt Projects Holdings Inc.)|BGLC - Price-to-Revenue Ratio|Price-to-Revenue Coefficient Gulf Resources Inc GURE|CN Energy (CNEY) - Price-to-Revenue Ratio|Market Cap to Revenue Arcadium Lithium plc|DNMR (Danimer Scientific Inc.) - P/S Multiple|Price to Sales glatfelter.com GLT|P/S Multiple GRFX|Price-to-Revenue Coefficient Invizyne Technologies Inc.