Stryve Foods - SNAX EV/EBITDA Multiple
Corporate emblem and logo of Stryve (SNAX)

The EV/EBITDA valuation chart on the GURU.Markets platform for Stryve Foods, Inc. (SNAX) is fixed at . Stryve Foods, Inc. (SNAX) generates revenue from premium additive-free beef jerky, which attracts health-conscious consumers. However, a high proportion of variable costs and the underutilization of new production facilities limit profit growth, preventing the efficient allocation of fixed costs and the full utilization of operating leverage.

SNAX Stryve Foods Inc.: Total Company Value to Operating Income Before Depreciation Ratio in the range 07/04/2022 - 11/14/2026

SNAX (Stryve Foods): analytical breakdowns and indicator data
- market price and analyst price targets:
Fundamental company valuation:Stryve Foods, Inc. (SNAX)
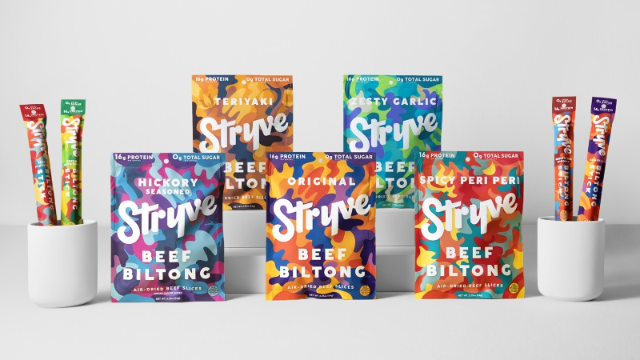
Product sample of stryve.com

Stryve Foods, Inc. (SNAX) focuses on profit optimization within the healthy snacks segment, making debt load control critical. This Enterprise Value to EBITDA multiple relates the total business value to operating income, allowing for an assessment of the real asset value inclusive of all liabilities. A decline in values on this chart may signal either that the company is undervalued or that default risks are increasing.

Key competitors

EV/EBITDA Multiple KHC (kraftheinzcompany.com)|Business Value to Operating Income Before Depreciation K|GIS - Enterprise Value to Earnings Before Interest, Taxes, Depreciation and Amortization|Total Company Value to Operating Income Before Depreciation Ratio McCormick MKC|JBS: EV/EBITDA Multiple|Hormel Foods Corp - Business Value to Operating Income Before Depreciation|SJM (J.M. Smucker) - EV/EBITDA Multiple|Company Value to EBITDA Pilgrim's Pride PPC|EV/EBITDA Multiple CPB|Smithfield Foods, Inc. - Enterprise Value to Operating Income Before Depreciation|EV/EBITDA Multiple INGR (Ingredion Incorporated)|LW (Lamb Weston Holdings) - Company Value to Operating Income Before Depreciation Ratio|BRFS: Enterprise Value to EBITDA Ratio|Business Value to Operating Income Before Depreciation POST (Post Holdings, Inc.)|MZTI: EV/EBITDA Multiple|Company Value to Operating Income Before Depreciation Ratio BRBR (Premier Protein)|TR (Tootsie Roll Industries) - EV/EBITDA Multiple|Company Value to EBITDA Flowers Bakeries FLO|Enterprise Value to Earnings Before Interest, Taxes, Depreciation and Amortization The Simply Good Foods Company (SMPL)|NOMD - Company Value to EBITDA|WK Kellogg Corporation - Enterprise Value to EBITDA Ratio|JJSF: Enterprise Value to Operating Income Before Depreciation|UTZ: Enterprise Value to EBITDA Ratio|Business Value to Operating Income Before Depreciation THS (TreeHouse Foods Corp)|STKL (SunOpta Foods) - Enterprise Value to EBITDA Ratio|Company Value to EBITDA Fisher Nuts (JBSS)|SENEA (Seneca Foods Company) - EV/EBITDA Multiple|Lifeway Foods - Company Value to Operating Income Before Depreciation Ratio|EV/EBITDA Multiple MAMA|BGS: Company Value to Operating Income Before Depreciation Ratio|Enterprise Value to Earnings Before Interest, Taxes, Depreciation and Amortization beyondmeat.com BYND|Business Value to Operating Income Before Depreciation HAIN|Bridgford Foods - EV/EBITDA Multiple|Company Value to EBITDA wingyip-food.com|LSF (lairdsuperfood.com) - Enterprise Value to EBITDA Ratio|BRLS - Total Company Value to Operating Income Before Depreciation Ratio|FARM (Farmer Bros. Co.) - EV/EBITDA Multiple|BOF (BranchOut Food) - Enterprise Value to Operating Income Before Depreciation Ratio|Enterprise Value to EBITDA Ratio PFAI (Pinnacle Food Group Inc)|SOWG (Sow Good) - Business Value to Operating Income Before Depreciation|Top Wealth Group Holding Ltd - Enterprise Value to EBITDA Ratio|Steakholder Foods Corp (STKH) - Company Value to EBITDA|Blue Star Foods - EV/EBITDA Multiple|Business Value to Operating Income Before Depreciation FREE (Whole Earth Brands Inc.)|T. Marzetti (LANC) - Enterprise Value to Earnings Before Interest, Taxes, Depreciation and Amortization|Enterprise Value to Operating Income Before Depreciation RGF|Enterprise Value to EBITDA Ratio SOVO