Smart Sand Inc (SND) Long-Term Debt to Equity

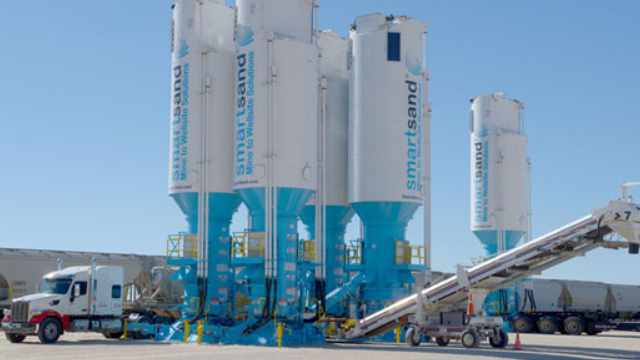
Intense price competition in the US shale sector is impacting price action, which is why GURU.Markets analytics includes this chart of the long-term debt-to-equity ratio. The 0.11 level captures the current state of the debt load. The fundamentals of Smart Sand, Inc. (SND) are based on the ownership of unique quarries and strict EPA oversight, while local logistics monopolies allow the company to exercise pricing power over sand costs.

Metric breakdowns and analytics for Smart Sand Inc (SND)
Smart Sand, Inc. (SND) remains vulnerable to market volatility due to its dependence on hydraulic fracturing dynamics and oil prices. An analysis of the long-term debt-to-equity ratio allows for an assessment of the business's resilience to such risks. This metric compares loans with maturities exceeding one year against shareholders' equity. A decrease in this value indicates growing financial autonomy; however, an excessive avoidance of borrowing may limit the overall return on invested capital.