Syndax Pharmaceuticals Inc (SNDX) Short-Term Debt to Equity
The price history on the Syndax Pharmaceuticals (SNDX) chart reflects the dynamics of a company implementing "green chemistry" principles and eco-friendly packaging to minimize production toxicity. The business relies on developing leukemia treatments, where the approval of new formulas paves the way for monopoly revenues via patents. The current metric stands at 0.58, while stringent FDA regulations ensure strict control over the distribution of life-saving drugs.

Financial and market metric breakdowns for syndax.com (SNDX)
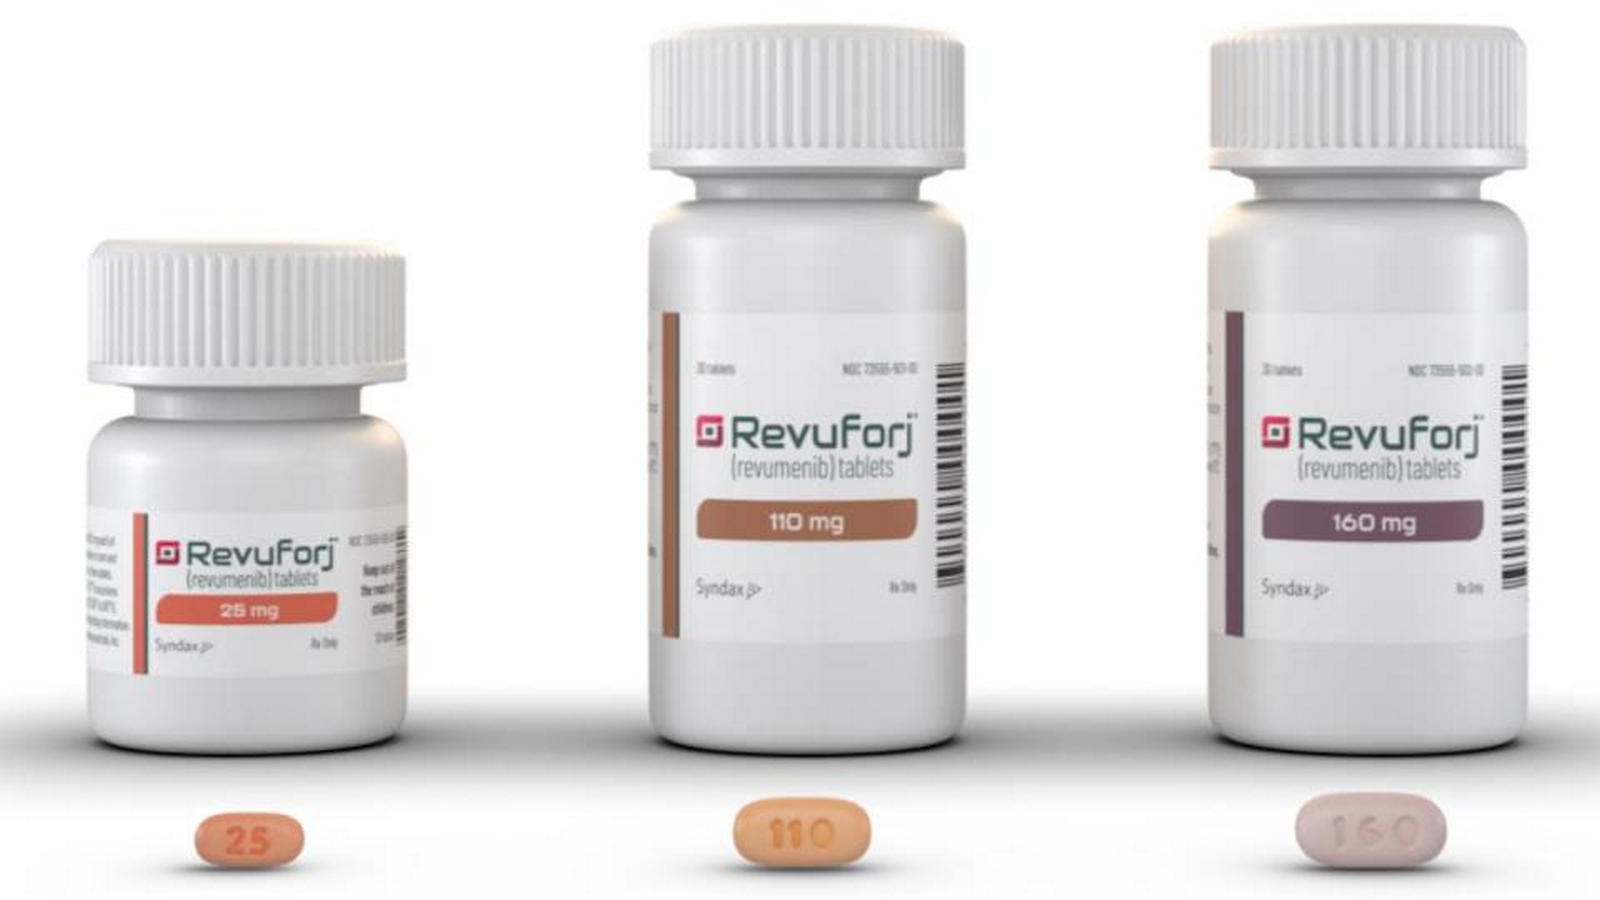
For Syndax Pharmaceuticals (SNDX), a biotech sector player developing epigenetic methods to combat cancer cell resistance, maintaining liquidity without the risk of cash flow gaps is critically important. By analyzing the history of short-term debt to equity, an investor assesses the proportion of liabilities maturing within one year relative to equity, which allows for the timely diagnosis of over-leverage and the threat of a credit crisis.