Sovos Brands, Inc. (SOVO) - Long-Term Liabilities to Capital
The production of premium sauces and semi-finished products by Sovos Brands, Inc. (SOVO) is low-cycle since food demand remains stable, although cost inflation may erode profitability. This daily price chart reflects this trend, where the indicator equals 0.91. Sovos Brands, Inc. (SOVO) is scaling its well-known brands through retail chains, while risks are linked to the rising cost of packaging, raw materials from Europe, and competition from budget supermarket private labels.

Comprehensive metric breakdowns and analytics for Sovos Brands, Inc. (SOVO)
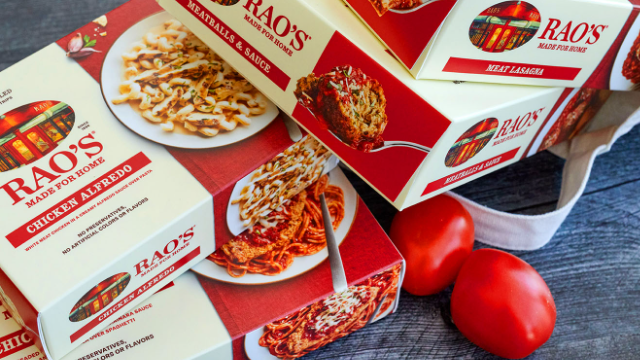
Maintaining complex refrigerated logistics for premium products requires significant capital expenditures. This indicator compares long-term liabilities (over one year) with the equity of Sovos Brands, Inc. (SOVO). The metric determines the degree of financial autonomy and resilience to inflationary pressure on debt servicing. A sharp decline in the ratio may indicate either deleveraging or an investment deficit. By analyzing the history of the long-term debt-to-equity ratio, an investor assesses the actual debt load.