SRM: SRM Entertainment, Inc Company Value to Net Income
Corporate emblem and logo of SRM Entertainment Inc. (SRM)

SRM Entertainment, Inc. (SRM) leverages cloud technologies to minimize environmental impact and focuses its ESG strategy on data security. However, souvenir production remains heavily dependent on holiday demand and sensitive to crises. The market's valuation trend for the asset is currently at -55.00, while the company consistently monetizes legacy animation franchises through licensing and merchandise sales.

SRM SRM Entertainment Inc: Price to Earnings Ratio in the range 02/21/2024 - 07/17/2025

Comprehensive metric breakdowns and analytics for SRM Entertainment Inc. (SRM)
- market price and analyst price targets:
Comprehensive company analysis:SRM Entertainment Inc. - SRM
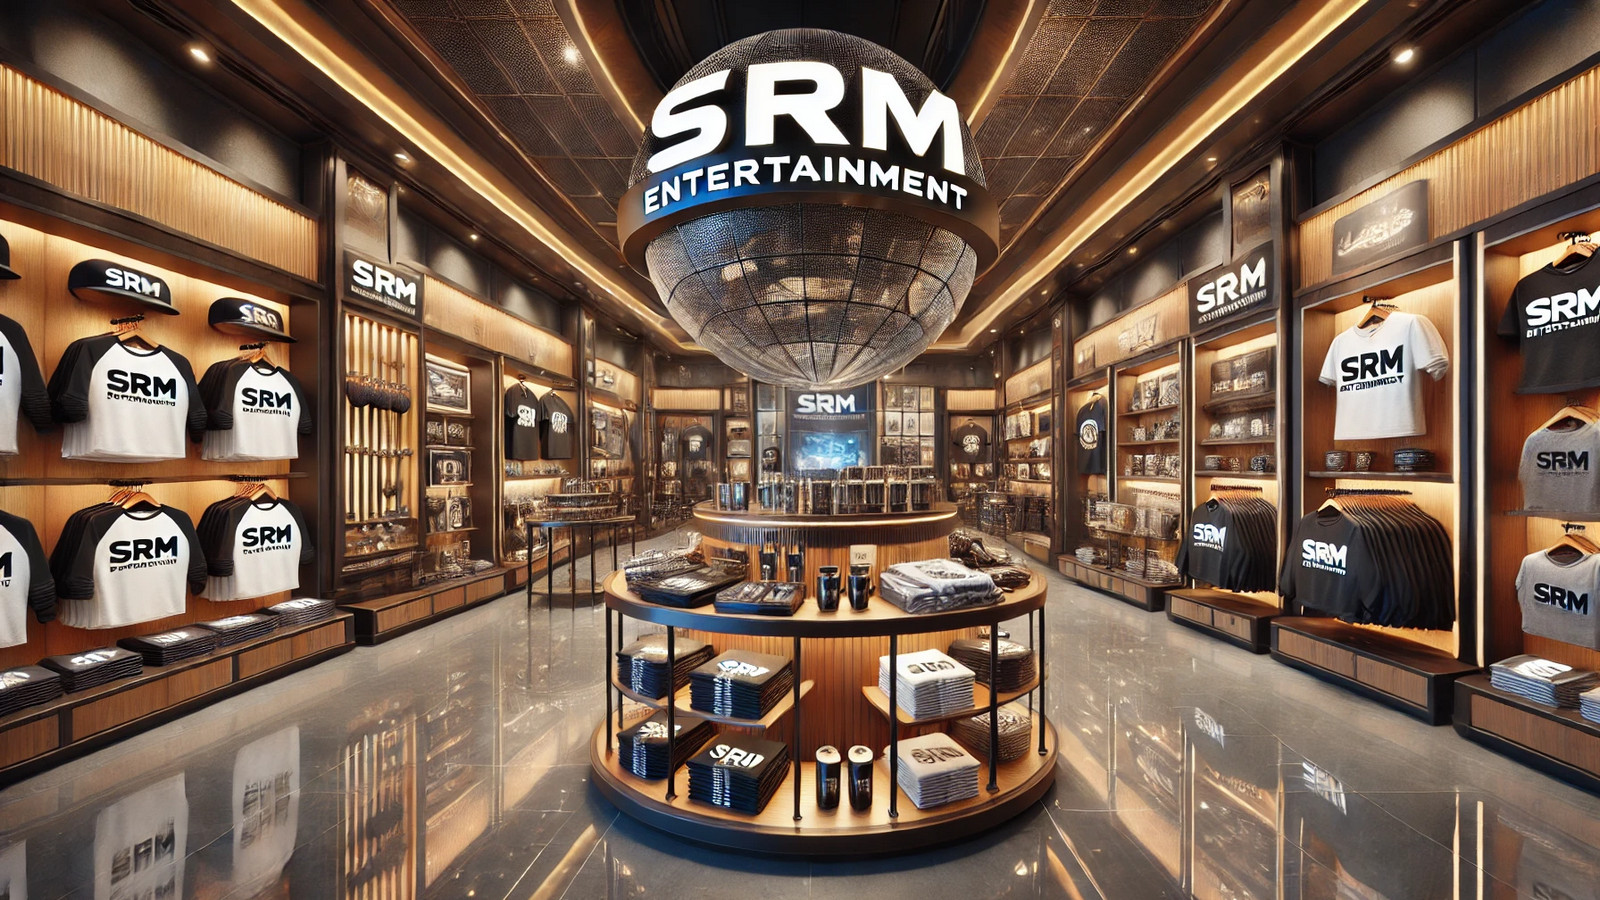
Flagship merchandise of SRM Entertainment

Effective asset selection requires aligning a business's market value with its actual ability to generate profit. The P/E ratio measures the investment payback period by dividing total market capitalization by the company's net income. For SRM Entertainment, Inc. (SRM), this calculation reflects the cost of expansion within the B2B theme park souvenir production sector. High values may signal inflated market expectations regarding the capture of leisure market shares. By analyzing the current P/E multiple, an investor can determine the degree to which the stock is overbought.

Analysis of competing companies

ABNB: Company Value to Net Income|Price to Earnings Ratio LYV (Live Nation Corp)|MSGS - Market Cap to Earnings|BRP Inc. - Price to Earnings Ratio|Company Value to Net Income GOLF|PII: Price to Earnings Ratio|Market Cap to Earnings United Parks & Resorts Corp|MANU (Manchester United) - Price to Earnings Ratio|Market Cap to Earnings Atlanta Braves Holdings (BATRK)|MSGE (MSG Entertainment) - P/E Multiple|SHCO: Company Value to Net Income|P/E Multiple MODG|FBYD - Market Cap to Earnings|Price to Earnings Ratio Bowlero Corp LUCK|Company Value to Net Income VENU|THH - Price to Earnings Ratio|Market Cap to Earnings Seaport Entertainment Group|Eventbrite, Inc. (EB) - Price to Earnings Ratio|European Wax Center Inc (EWCZ) - P/E Multiple|RICK (RCI Hospitality Holdings, Inc.) - P/E Multiple|Price to Earnings Ratio SEAT|Price to Earnings Ratio PLBY (PLBY Group Inc.)|RDNW - Market Cap to Earnings|P/E Multiple AOUT (American Outdoor Brands Inc)|Company Value to Net Income RGS|AGH: Price to Earnings Ratio|SBDS: Price to Earnings Ratio|Sotherly Hotels Inc (SOHO) - Price to Earnings Ratio|Price to Earnings Multiple MGIH|MMA (Alta Global Group) - P/E Multiple|GDHG: Company Value to Net Income|Price to Earnings Ratio Brera (BREA)|Price to Earnings Ratio Fast Track Events FTRK|Price to Earnings Ratio Newton Golf Co NWTG|RIME - Price to Earnings Ratio|BOWL - Price to Earnings Ratio|Market Cap to Earnings Endeavor Group Holdings|Strong Entertainment (SGE) - Price to Earnings Ratio|SPGC: Market Price to Net Income Ratio|Price to Earnings Ratio vistaoutdoor.com