SSP - Scripps Market Capitalization-to-Revenue Ratio

Corporate company logo of E.W. Scripps Company (SSP)

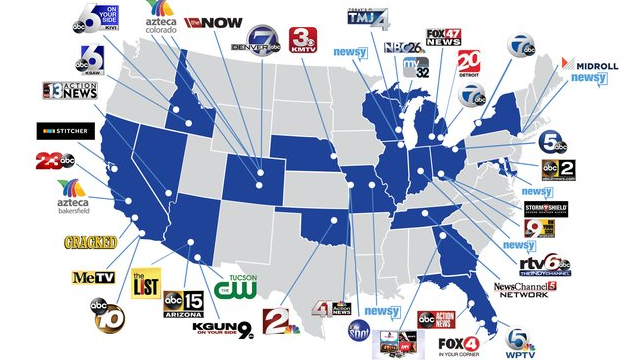
The E.W. Scripps Company (SSP) business is shielded from external pressure by focusing exclusively on the US domestic market. Its infrastructure relies on a network of local stations with autonomous power supplies. The price-to-sales ratio clearly smooths out market noise, with the indicator currently standing at 0.10. However, financial results remain dependent on advertising budgets and the expansion of streaming services.

E.W. Scripps (SSP): P/S Multiple from 07/04/2022 to 11/15/2026

Analytical breakdowns for scripps.com (SSP)
- price and consensus price forecast:
- market capitalization statistics:
Fundamental company analysis:E.W. Scripps Company - SSP
Finished products of The E.W. Scripps Company

Effective digital distribution of media content for The E.W. Scripps Company (SSP) requires an assessment of market value relative to actual operating income. The P/S ratio compares the capitalization of SSP to its revenue, allowing investors to identify imbalances between stock quotes and actual cash flow. By analyzing price-to-sales dynamics, one can determine the asset's overvaluation stage or find an entry point when the metric reaches a historical low.

Competitors of The E.W. Scripps Company

Price-to-Revenue Coefficient Comcast Corp.|Price-to-Revenue Ratio Warner Bros. Discovery WBD|P/S Multiple Formula One Group FWONA|FOXA - Price-to-Revenue Ratio|Paramount Skydance - Market Cap to Sales Volume|News Corp (NWS) - Price-to-Revenue Ratio|TME - Price-to-Revenue Coefficient|Price-to-Revenue Ratio roku.com|P/S Multiple The New York Times Company|Price-to-Revenue Ratio Sirius XM Holdings (SIRI)|Price-to-Revenue Coefficient Nexstar Media Group|Trump Media & Technology Group - Market Cap to Revenue|TGNA: Market Cap to Revenue Ratio|WBTN: Market Cap to Revenue|Price to Sales Atlanta Braves Corp|SPHR: P/S Multiple|Adeia (ADEA) - P/S Multiple|Market Cap to Revenue NMAX|Market Cap to Revenue fuboTV (FUBO)|Market Cap to Revenue TV (Grupo Televisa SAB)|Market Cap to Sales Volume HLIT|Price-to-Revenue Ratio sbgi.net SBGI|Price-to-Revenue Coefficient gannett.com (GCI)|Daily Journal Corp. - P/S Multiple|Price-to-Revenue Coefficient Gray Television GTN|IHRT (iHeartMedia) - Market Cap to Revenue|Market Cap to Revenue AMC Networks Inc.|CURI (curiositystream.com) - P/S Multiple|P/S Multiple thearenagroup.net|Price-to-Revenue Ratio Starz Entertainment LLC (STRZ)|Price-to-Revenue Coefficient Entravision Communications Corporation|Price-to-Revenue Ratio Generation Essentials Corp TGE|Price-to-Revenue Multiple Townsquare Media Corp|DallasNews Corporation - P/S Multiple|SGA (sagacom.com) - Market Cap to Revenue Ratio|MediaCo Holding, Inc. (MDIA) - Price-to-Revenue Ratio|Price-to-Sales Ratio BZFD (BuzzFeed, Inc)|CNVS (Cineverse) - P/S Multiple|Price-to-Revenue Ratio UONE|P/S Multiple LEE|Market Cap to Sales Volume SJ|P/S Multiple SEGG (SEGG Media)|P/S Multiple Cre8 Enterprise Ltd CRE|Beasley Media Group - P/S Multiple|AUUD (Auddia Corp) - Market Cap to Revenue Ratio|cumulusmedia.com (CMLS) - Price-to-Revenue Ratio|Market Cap to Revenue paramount.com