SUP: Superior Industries International Inc. Market Price to Net Income Ratio

Symbol and logo of brand Superior Industries International Inc. (SUP)

Superior Industries is expanding its global B2B supplies of aluminum wheels to grow its presence in the auto components segment. The stock's price history reflects the P/E multiple dynamics, which currently stands at -0.10. The business model's revenues are based on large-scale agreements with global OEM manufacturers. However, high borrowing costs and a potential decline in vehicle production in Europe and the US pose threats to profitability.

Superior Industries International (SUP) Price to Earnings Ratio: for the period 07/04/2022 - 06/28/2025

Analytical breakdowns for Superior Industries
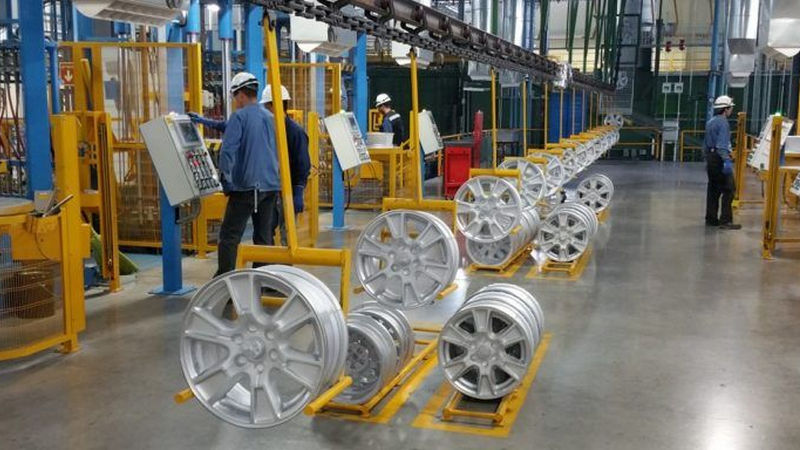
Core merchandise of Superior Industries International, Inc.

For the long-term investor, Superior Industries (SUP) is an attractive prospect as a stable player in the cyclical auto components sector. The P/E ratio reflects the cost of a single unit of net profit, measuring the market's valuation of the company's future earnings. By analyzing the P/E ratio trends for Superior Industries (SUP) on GURU.Markets, one can assess the degree of asset overheating. Low indicator values often confirm sales stability driven by the supply of wheels for electric vehicles, which ensures capital protection against bubbles.

Analysis of competing companies

P/E Multiple O'Reilly|Price to Earnings Ratio AZO (AutoZone)|Market Price to Net Income Ratio CMI|Price to Earnings Ratio genpt.com GPC|Business Payback Period magna.com (MGA)|RBC - Price to Earnings Ratio|ALV - P/E Multiple|borgwarner.com (BWA) - Price to Earnings Ratio|LKQ Corporation Inc. (LKQ) - P/E Multiple|Price to Earnings Ratio Allison Transmission|P/E Multiple lear.com|Price to Earnings Ratio VVV (Valvoline)|DORM (Dorman) - Company Value to Net Income|Atmus Filtration Technologies Inc. - Price to Earnings Ratio|AAP: Price to Earnings Multiple|Driven Brands Holdings Inc. - P/E Multiple|Business Payback Period dana.com DAN|GTX (Garrett Motion Inc.) - Price to Earnings Ratio|Price to Earnings Multiple GT|Price to Earnings Ratio PHIN|P/E Multiple Adient Corp|Price to Earnings Ratio FOXF (FOX Shocks)|Price to Earnings Ratio XPEL Protective Films XPEL|Price to Earnings Ratio Standard Motor Products SMP|P/E Multiple AAM AXL|CPS - Price to Earnings Ratio|Business Payback Period Monro Corp MNRO|HLLY (holley.com) - Price to Earnings Ratio|Motorcar Parts Corp (MPAA) - P/E Multiple|Price to Earnings Ratio caasauto.com|MTEN (Mingteng International) - Market Price to Net Income Ratio|P/E Multiple SYPR|PRTS (CarParts.com, Inc.) - Company Value to Net Income|Westport Fuel Systems - Price to Earnings Ratio|Business Payback Period worksport.com (WKSP)|inneova.co - P/E Multiple|Business Payback Period Carbon Revolution Public Limited Company CREV|SAG Group (SAG) - Price to Earnings Ratio