SW: Smurfit Westrock Plc Cash Calculated per Single Share

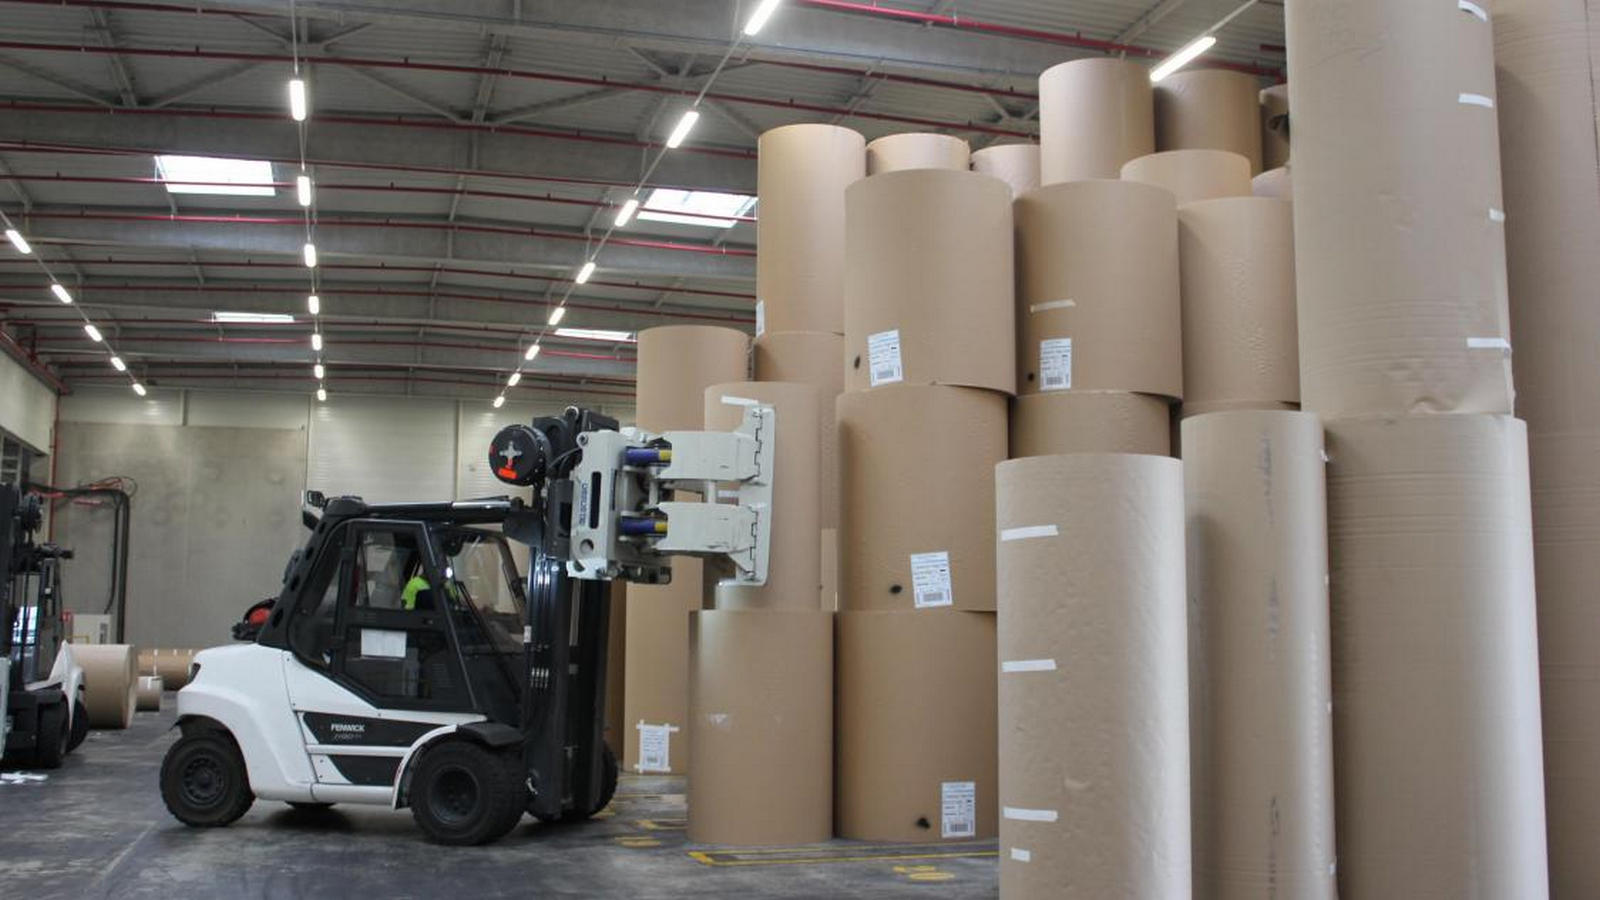
Post-merger synergies are helping Smurfit Westrock Plc (SW) reduce costs and generate cash to settle its obligations. The cash per share distribution visualizes the company's liquidity, where the 1.37 mark indicates the level of available resources. A global network of plants ensures the stability of packaging supplies, while the scale of the business guarantees reliable employment and high social standards for personnel.

Analytical breakdowns for Smurfit Westrock Plc
This indicator determines the volume of liquidity per ordinary share, allowing for the differentiation of long-term capital accumulation from short-term payouts. By analyzing the cash per share calculation, an investor can assess the financial stability of Smurfit Westrock Plc (SW) during periods of volatile demand for corrugated packaging and the efficiency of asset integration following the merger, which confirms the business's margin of safety.
