SXC - SunCoke Energy, Inc. Revenue Growth YoY (Last 12 Months)

This LTM sales volume growth chart compared to last year on GURU.Markets reflects current dynamics, where the 3.00 indicator determines the metric's magnitude for SunCoke Energy, Inc. (SXC). Growth is driven by the ownership of high-tech plants in Brazil and the US, although the business relies on demand from steel behemoths and compliance with environmental standards. Long-term contracts with the largest metallurgical companies guarantee stable sales.

SunCoke Energy - analytical breakdowns and key metrics (SXC)
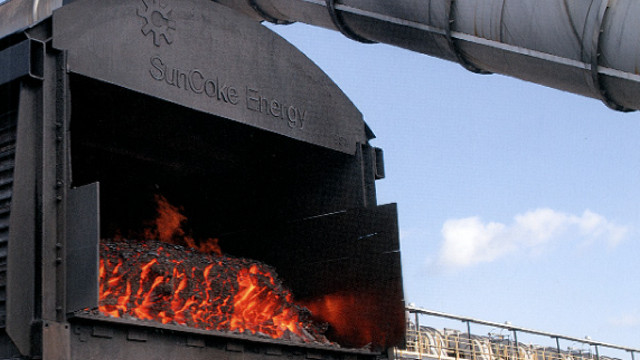
To objectively assess the operational efficiency of SunCoke Energy, Inc. (SXC), investors must track revenue scaling rates while neutralizing seasonal fluctuations. This metric calculates the percentage growth of the rolling annual revenue, where the annual sales trend over four quarters confirms the resilience of a business model protected by "take-or-pay" contracts that pass commodity risks onto customers.
