TAT Technologies Ltd. (TATT) - Ratio of Long-Term Indebtedness to Capital

This TAT Technologies Ltd. (TATT) price chart illustrates the stock dynamics of a cooling systems manufacturer protected by unique patents and stringent US and Israeli defense industry standards, with the indicator standing at 0.08. Stable revenue is driven by the multi-year operational cycles of combat aircraft and long-term service contracts. The business relies on the expansion of its own order book and strategic alliances with the largest aircraft manufacturers.

Comprehensive metric breakdowns and analytics for TAT Technologies Ltd. (TATT)
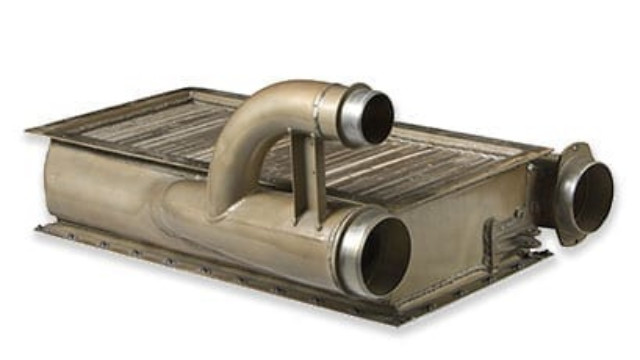
For TAT Technologies Ltd. (TATT), which is expanding its aviation heat exchangers through defense alliances and M&A, this indicator reflects the balance between long-term debt and equity. By analyzing the long-term debt-to-equity ratio, an investor assesses the risk of default against the pace of expansion: low values guarantee financial stability, yet excessive conservatism may slow down production modernization and the company's strategic growth.