TDY teledyne.com: Price-to-Projected Revenue Ratio

Teledyne Technologies (TDY) cash flow efficiency is driven by a model of serial niche asset acquisitions coupled with strict cost discipline. The forward P/S history clearly confirms these successes, where the 3.70 metric determines the status of the business valuation parameter. Demand resilience is based on a broad pool of B2B customers and patents, while profitability relies on government contracts for the supply of sensors and drones.

Analytical breakdowns for teledyne.com (TDY)
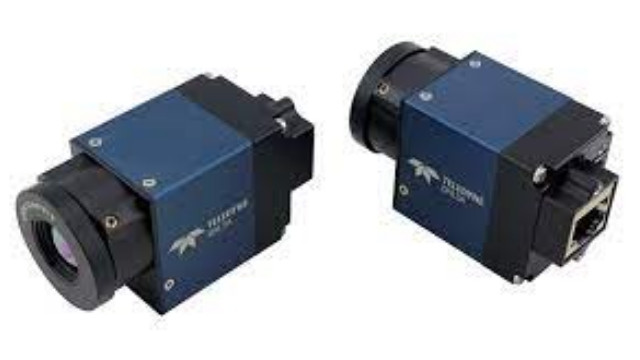
Supplies of high-tech sensors and radars for the defense sector form the revenue base of Teledyne Technologies (TDY). The ratio of current market capitalization to expected sales volume allows for the measurement of the market value of every dollar of future inflows. By analyzing the business's forward P/S, an investor determines the balance between the premium for technological leadership and the risk of overpaying if projected sales targets are not met.
