Team Industrial Services (TISI): Market Capitalization-to-Revenue Ratio

Corporate company logo of TEAM (TISI)

High debt leverage and the cyclical nature of oil and gas sector costs create financial risks, yet the volatility of the P/S ratio demonstrates how Team, Inc. (TISI) mitigates these through its unique ability to perform equipment repairs without shutdowns. The value of 0.10 serves as the baseline figure for the asset valuation parameter. Service stability is ensured by the efficient maneuvering of equipment between regional centers, which guarantees the continuity of future operations.

TISI TEAM: P/S Multiple in the range 07/04/2022 - 11/13/2026

Analytical breakdowns for Team, Inc. (TISI)
- stock value and consensus price forecast:
- stock exchange capitalization data:
Summary company analytics:Team Industrial Services
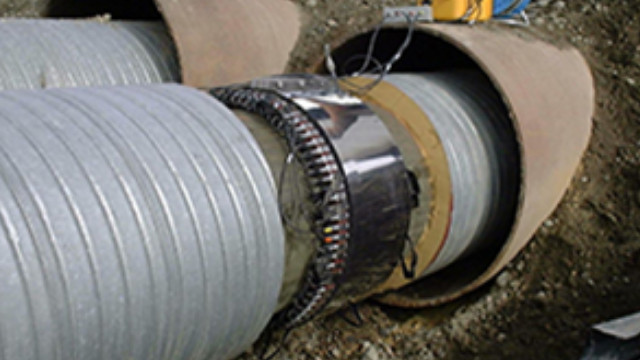
Manufactured products of teaminc.com

The P/S multiple compares the market capitalization of Team, Inc. (TISI) to its generated revenue, determining the cost of each unit of income. By analyzing the P/S chart, an investor assesses the extent of the premium paid for the business relative to its operating sales. The indicator's dynamics are sensitive to quarterly reports, reflecting market confidence in asset management efficiency. For Team, Inc. (TISI), a low ratio may signal a discount driven by critical debt loads and operational risks within the oil and gas sector.

Competing companies

P/S Multiple cintas.com (CTAS)|Price-to-Revenue Ratio Thomson Reuters Corporation TRI|Market Capitalization-to-Revenue Ratio HLI|Booz Allen Hamilton Inc. - P/S Multiple|Rentokil Initial Group (RTO) - Market Cap to Revenue|EXLS: P/S Multiple|PJT - Price-to-Revenue Coefficient|Price-to-Revenue Ratio Moelis|Market Cap to Revenue Ratio FCN (FTI Consulting Inc)|P/S Multiple CNXC|Exponent Corp (EXPO) - Price-to-Revenue Multiple|WNS Global Services - Market Cap to Revenue|Market Cap to Sales Volume CBZ (cbiz.com)|ABM Building Value - P/S Multiple|Price to Sales Acuren Corporation|LZ: P/S Multiple|ICF Corp (ICFI) - P/S Multiple|Price-to-Revenue Ratio TaskUs, Inc.|Market Cap to Revenue willdan.com (WLDN)|Market Cap to Revenue CRAI (CRA International)|TIXT (TELUS International Inc.) - Market Capitalization-to-Revenue Ratio|P/S Multiple DLX (Deluxe Corp.)|Price-to-Revenue Coefficient Performant Healthcare Corp (PHLT)|HCKT - Price-to-Revenue Ratio|IBEX (IBEX Limited) - Market Cap to Revenue Ratio|ANPA: P/S Multiple|Market Cap to Revenue xerox.com|Market Cap to Revenue CNDT|Kingsway Financial (KFS) - Price-to-Revenue Coefficient|Market Cap to Revenue INV (Innventure, Inc.)|Market Cap to Sales Volume LPRO|P/S Multiple RCMT (RCM Technologies)|Price-to-Revenue Coefficient TTEC Holdings Inc. (TTEC)|RGP - Price-to-Revenue Ratio|Price-to-Revenue Coefficient Enigmatig Ltd EGG|PMEC: P/S Multiple|ACCS - Price-to-Revenue Coefficient|Price-to-Revenue Ratio Harte Hanks|Price to Sales rYojbaba Ltd RYOJ|Market Cap to Revenue SPPL (Simpple Ltd.)|Market Cap to Sales Volume GRNQ|P/S Multiple WAI (Top KingWin Ltd)|Market Capitalization-to-Revenue Ratio QH|Powell Max - P/S Multiple|Price to Sales Lichen China Ltd|bluemount.com (BMHL) - Price-to-Revenue Ratio|Zenta Group - Market Capitalization-to-Revenue Ratio|Market Cap to Revenue FOFO|ARC: Market Capitalization-to-Revenue Ratio|Price-to-Revenue Ratio GSE Systems, Inc. (GVP)|NVEE - Price to Sales|Performant Financial Corp - Market Cap to Revenue|P/S Multiple Sterling Check Corp STER|TDCX: Market Cap to Revenue