TMDE - TMD Energy Corp Market Cap to Sales Volume
Brandmark of TMD Energy Corp (TMDE)

TMD Energy Limited (TMDE) relies on a modern tanker fleet and expertise in freight risk management. This P/S ratio chart on GURU.Markets illustrates the current trend, where 0.10 characterizes this valuation metric. The business is subject to strong cyclicality and the influence of oil prices, while its narrow specialization in petroleum product transport is offset by a shift toward long-term charters.

TMDE TMD Energy Corp: P/S Multiple in the range 04/22/2025 - 11/13/2026

Analytical breakdowns for TMD Energy Limited (TMDE)
- share price and consensus valuation forecast:
- market capitalization statistics:
Fundamental company analysis:TMD Energy Ltd (TMDE)
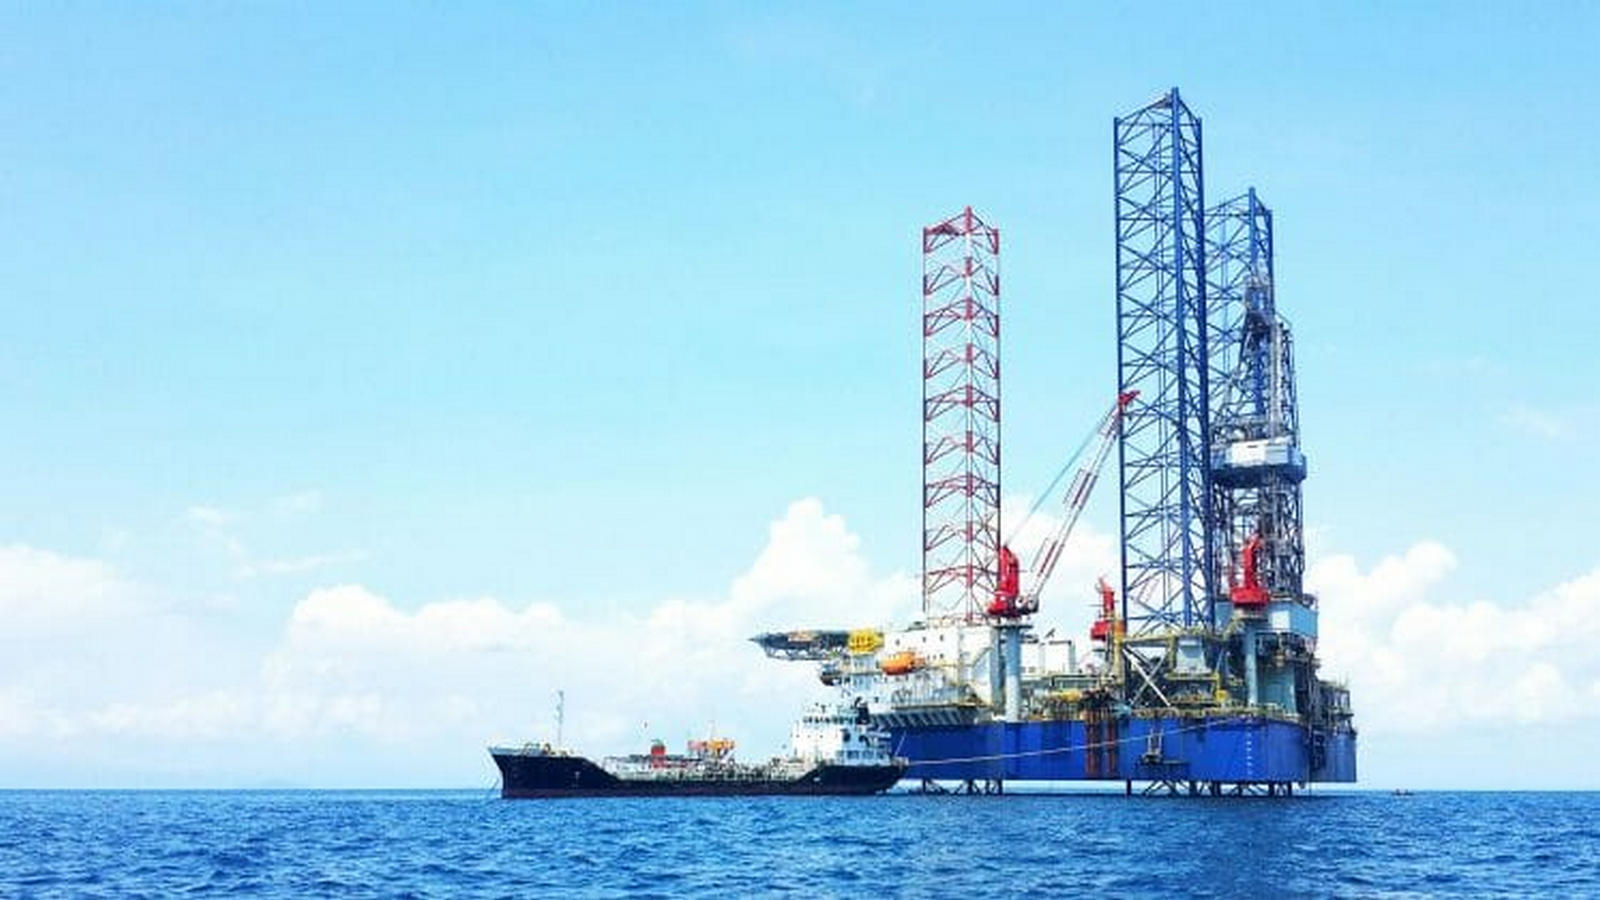
Finished products of TMD Energy Corp

The P/S ratio compares a business's market value to its sales volume, allowing an investor to assess the premium paid per unit of revenue and identify the risk of fundamental asset overvaluation. By analyzing the capitalization-to-revenue trend of TMD Energy Limited (TMDE), one can confirm the business's resilience, where stable transactional demand for bunkering ensures a predictable cash flow and justifies the current market multiple.

Competing companies

MATX (matson.com) - Market Capitalization-to-Revenue Ratio|Hafnia - Market Cap to Revenue|Market Cap to Sales Volume CMBT (Euronav N.V.)|BWLP - Price-to-Revenue Ratio|TORM Tankers (TRMD) - Market Cap to Revenue|SBLK: P/S Multiple|Market Cap to Revenue Ratio ZIM|Market Cap to Revenue DAC|CMRE: Market Capitalization-to-Revenue Ratio|P/S Multiple GSL|SFL - Price to Sales|Price-to-Revenue Ratio Teekay Corporation TK|ASC: Market Cap to Revenue Ratio|Safe Bulkers - P/S Multiple|Price to Sales Euroseas Ltd|costamarebulkers.com (CMDB) - Price-to-Revenue Ratio|Uni-Fuels Group - Market Capitalization-to-Revenue Ratio|DSX (Diana Shipping Inc.) - P/S Multiple|VNTG - Price-to-Revenue Multiple|Market Cap to Revenue SMHI (SEACOR Marine)|SHIP - Price to Sales|Toro Corp. - Market Cap to Revenue|Market Capitalization-to-Revenue Ratio HTCO|NCT - Price-to-Revenue Ratio|EDRY: Price-to-Revenue Ratio|PXS: P/S Multiple|TOPS - Price-to-Revenue Coefficient|Price-to-Revenue Ratio Performance Shipping Inc|Market Cap to Revenue Globus Maritime Ltd (GLBS)|P/S Multiple CTRM|Price-to-Revenue Coefficient banle-intl.com|United Maritime Corporation - Market Cap to Revenue|Market Cap to Sales Volume RBNE (Robin Energy Ltd.)|Tianci International Corp - P/S Multiple|Price to Sales PTL Ltd|SGLY: P/S Multiple|Market Cap to Revenue Ratio CISS|Market Cap to Revenue ICON|HMR (Heidmar Maritime Holdings) - Market Cap to Sales Volume|Price-to-Revenue Ratio Caravelle International Group, Inc. (CACO)|Market Cap to Revenue Capital Product Partners, L.P. CPLP|P/S Multiple ESEAV (Euroseas)