TNON (tenonmed.com) Earnings per share growth this year

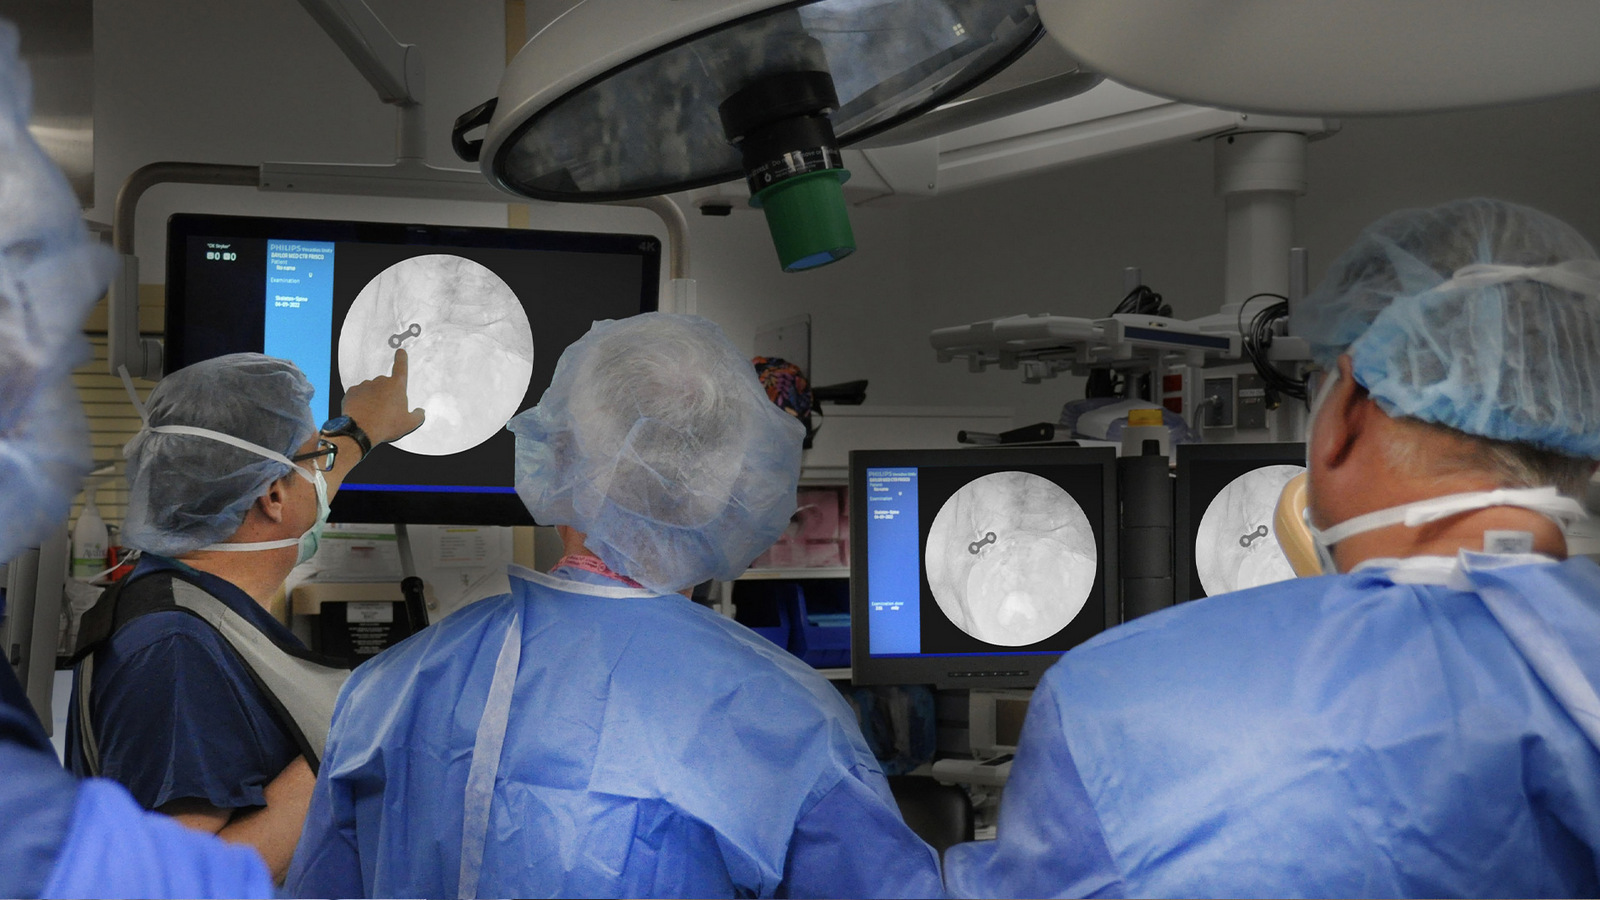
Tenon Medical, Inc. (TNON) cash flows are vulnerable due to a heavy concentration on a single joint fixation system. The annual EPS growth rate on the GURU.Markets chart reflects current dynamics, where the parameter value equals 73.70. Robotic implant production lines ensure stability, while high margins are achieved through the mass production of standardized pins under fixed costs.

Financial and market metric breakdowns for Tenon Medical, Inc (TNON)
This indicator captures the annual percentage change in net income per share, measuring the efficiency of capital generation. Growth in this metric confirms the business's fundamental strength, while stagnation signals a risk of price correction. By analyzing EPS dynamics compared to the previous year, an investor assesses the real momentum of profitability. For Tenon Medical, Inc. (TNON), this figure reflects the success of expanding surgical systems into US and European markets. Geographic sales diversification minimizes the dependence of profits on local medical insurance regulations.
