TPHS Trinity Place Holdings Inc. Total Debt to Capital

This daily price chart of the debt-to-equity ratio for Trinity Place Holdings (TPHS) is fixed at 0.00, highlighting a shortage of free cash flow due to costly loan servicing in New York. Modern IT property management tools and design automation help alleviate the operational burden. The developer's financial stability relies on the sale of premium residential properties and rental income from retail spaces.

Comprehensive metric breakdowns and analytics for Trinity Place Holdings, Inc (TPHS)
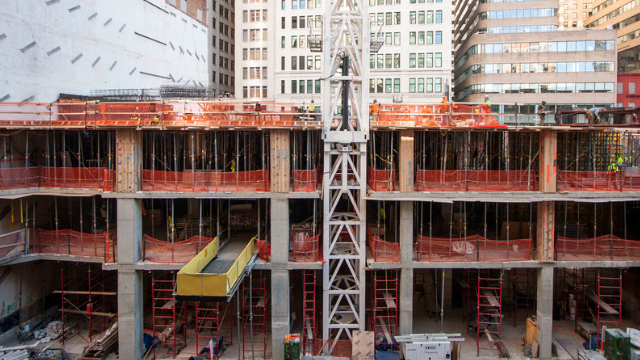
Investors are assessing the resilience of Trinity Place Holdings (TPHS) through the balance between borrowed funds and equity, where an increasing share of liabilities signals risks of excessive leverage. By analyzing the total financial debt-to-equity ratio, one can determine how aggressively Trinity Place Holdings (TPHS) is financing premium New York real estate development to capture market share. A decrease in this metric confirms a strengthening financial base, which enhances investment reliability as asset values scale.