Tyson Foods Inc (TSN): Price-to-Revenue Coefficient

Tyson Foods, Inc. (TSN) profitability relies on feed costs and meat market cycles. The volatility of the P/S ratio helps track these factors, with the indicator currently standing at 0.30. Advanced cold chain logistics provide stability. Despite automation efforts, product processing still relies on the intensive manual labor of thousands of employees.

Metric breakdowns and analytics for Tyson (TSN)
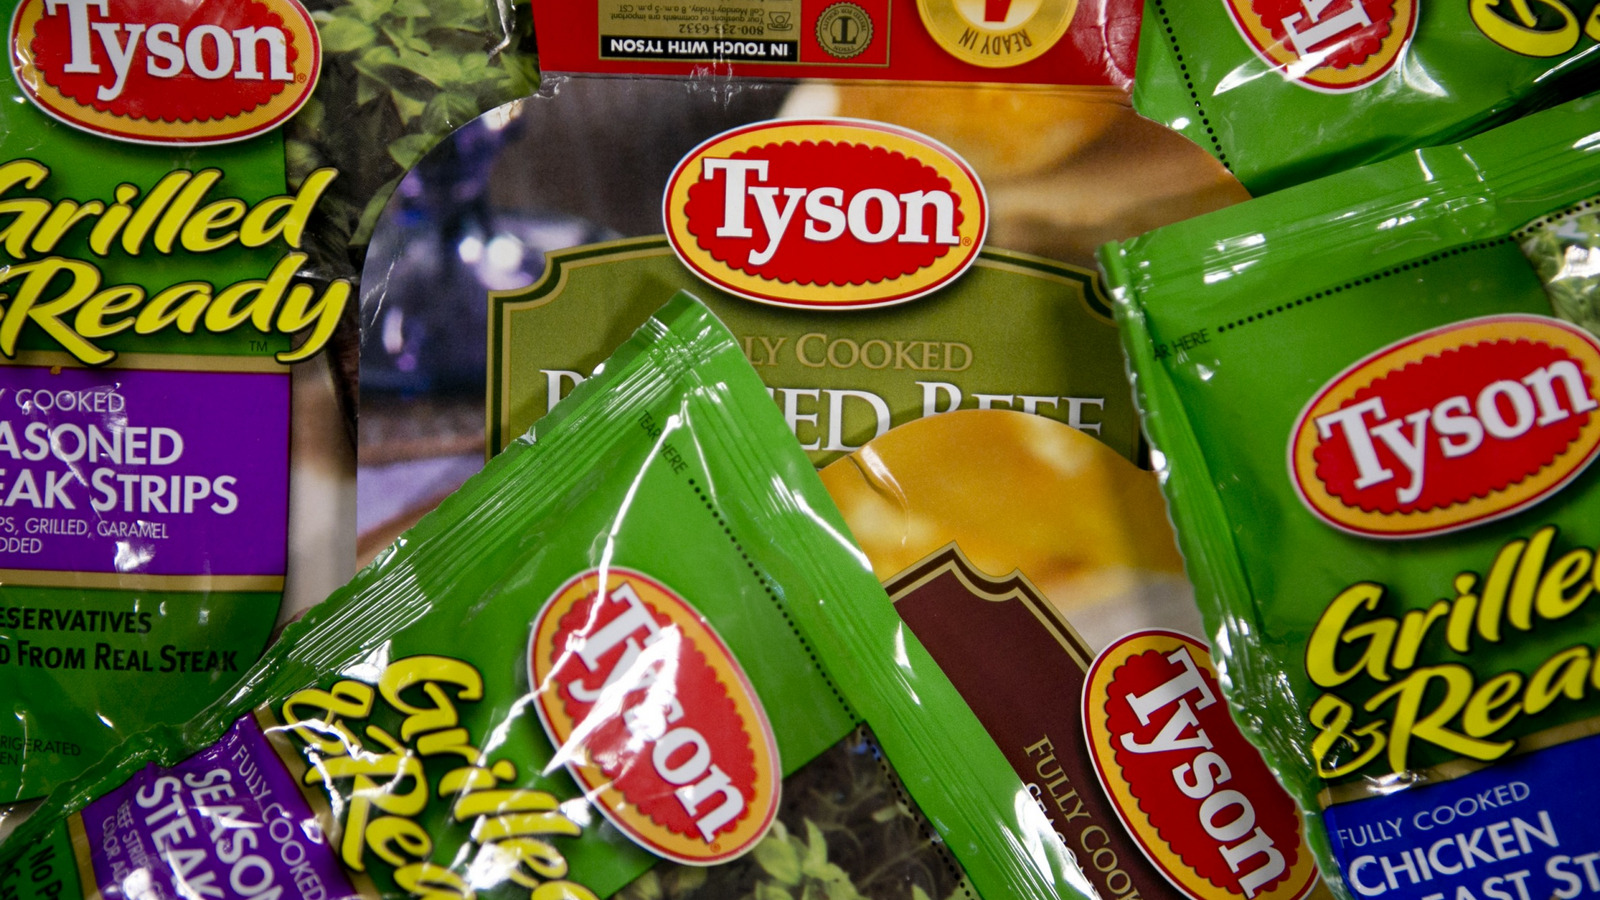
Fluctuations in the P/S multiple reflect the market's valuation of the efficiency of implementing robotic deboning and machine vision into the operational processes of Tyson Foods, Inc. (TSN). This ratio, calculated as the relationship between market capitalization and annual revenue, measures the cost of one dollar of sales, allowing investors to determine the degree of asset overheating and assess the potential for capital growth relative to the business's actual earnings.
