TWFG - TWFG, Inc. Market Cap to Sales Volume

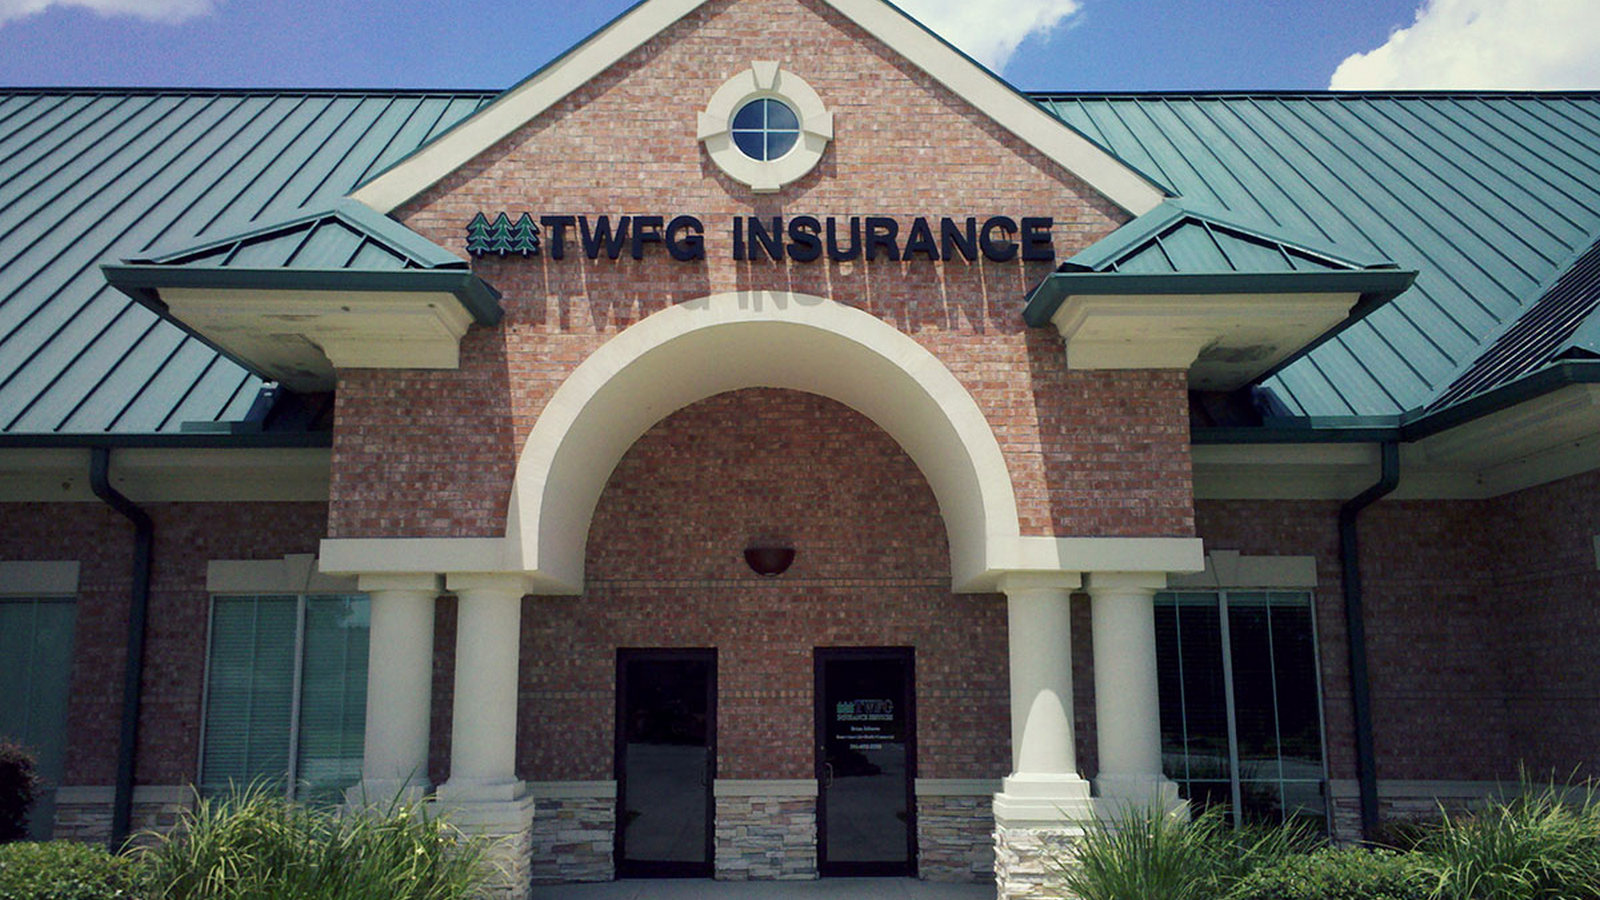
Symbol and logo of brand twfg.com (TWFG)

The independent broker model of TWFG, Inc. (TWFG) ensures profit stability by offering policies from numerous insurers across the United States. The firm minimizes logistical risks for clients, thereby supporting supply chain profitability. Revenues are based on commissions from the retail segment and small businesses. The company's industry-average P/S reflects the business valuation trend, with the value holding at 1.10.

TWFG twfg.com: P/S Multiple in the range 11/19/2024 - 11/14/2026

TWFG, Inc. (TWFG) - metric breakdowns and financial figures
- current quotes and average value forecast:
General company analysis:TWFG, TWFG Insurance
Manufactured product of TWFG Inc

For TWFG, Inc., whose business relies on high customer trust in the national insurance network, the P/S multiple determines the market value of every dollar of generated revenue. By analyzing current P/S dynamics on the GURU.Markets platform, an investor assesses the ratio of market capitalization to sales volume, which allows them to identify asset overheating or find an entry point with a minimal risk of a deep drawdown.

Competitors of TWFG, Inc.

PGR - Price to Sales|Chubb - Market Cap to Revenue|Market Cap to Sales Volume TRV (The Travelers Companies, Inc.)|ALL: Market Cap to Revenue|American International Group Inc (AIG) - Market Cap to Revenue|HIG: P/S Multiple|Price-to-Sales Ratio ACGL (archgroup.com)|BRO (Brown & Brown) - P/S Multiple|WRB - Price-to-Revenue Multiple|Market Cap to Revenue CINF (Cincinnati Insurance)|L (Loews Companies) - Market Capitalization-to-Revenue Ratio|P/S Multiple CNA (CNA Financial Corporation)|Price-to-Revenue Coefficient American Financial Group, Inc. (AFG)|KNSL - Price-to-Revenue Ratio|AXS (AXIS Capital Holdings Limited) - Market Cap to Revenue Ratio|THG: P/S Multiple|Market Cap to Revenue RLI Insurance|Market Cap to Revenue FTDR|selective.com (SIGI) - Price-to-Revenue Coefficient|Market Cap to Revenue HGTY (Hagerty)|Market Cap to Sales Volume MCY|Kemper Auto - Market Cap to Revenue|PLMR - Market Cap to Revenue|HCI Group, Inc. - P/S Multiple|Price-to-Sales Ratio SKWD|SLDE: P/S Multiple|Price-to-Revenue Multiple safetyinsurance.com SAFT|ASIC (Ategrity Corp) - P/S Multiple|Bowhead Specialty Holdings Inc. - Price-to-Sales Ratio|P/S Multiple AMSF|UFCS - Price to Sales|P/S Multiple HRTG (Heritage Insurance Holdings)|P/S Multiple Universal Insurance Holdings, Inc. UVE|DGICA - Price-to-Revenue Ratio|Market Capitalization-to-Revenue Ratio ACIC (American Coastal Group)|GBLI (Global Indemnity Group) - Market Cap to Revenue|NI Holdings - Market Capitalization-to-Revenue Ratio|Price-to-Revenue Ratio Kingstone Companies, Inc.|Cheche Technology - Price-to-Sales Ratio|Price-to-Revenue Ratio U-BX Technology Ltd. (UBXG)|CNFR (Conifer Holdings Inc) - Market Capitalization-to-Revenue Ratio|P/S Multiple XHG (XChange TEC.INC)|Price-to-Revenue Coefficient Fanhua Inc (FANH)|ICCH: Market Cap to Revenue