Wayfair Corp (W) Market Cap to Earnings

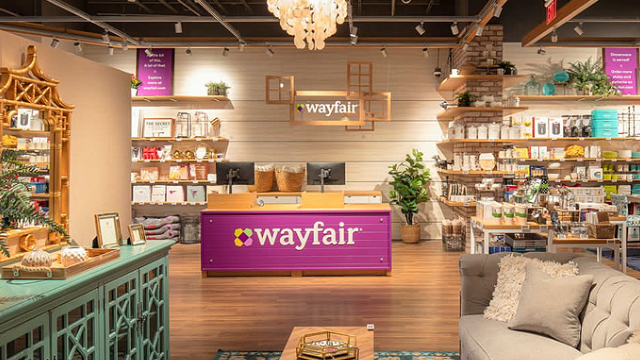
Corporate emblem and logo of Wayfair LLC (W)

Wayfair Inc. (W) historical P/E reflects the company's dependence on the housing sector and profitability risks. Against this backdrop, the business is implementing sustainable logistics and certified raw materials, supported by an optimized staff of IT specialists. The price action relative to earnings is clearly illustrated on this chart, where -85.20 serves as the final marker for the issuer's current market valuation.

Price to Earnings Ratio: Wayfair (W) for 07/04/2022 - 11/10/2026
Core merchandise of Wayfair

The P/E ratio determines the market value of one dollar of a company's net profit. This metric compares market capitalization with annual income, which allows the issuer's P/E chart to identify whether an asset is overvalued or undervalued. The current value of -85.20 reflects market expectations for the efficiency of Wayfair Inc. (W). For this dropshipping model, the indicator is critical as it links business value to marketing expenses and logistical optimization.

Key competitors

FERG: Company Value to Net Income|Price to Earnings Ratio Tractor Supply (TSCO)|WSM - Market Cap to Earnings|Price to Earnings Ratio Ulta Beauty Inc ULTA|DG - Price to Earnings Ratio|DKS: Price to Earnings Ratio|dollartree.com (DLTR) - Price to Earnings Ratio|BBY: P/E Multiple|Pool Corp (POOL) - P/E Multiple|Price to Earnings Ratio GME|Market Cap to Earnings Ollie's Corp OLLI|P/E Multiple ELF|FIVE: Market Cap to Net Income|P/E Multiple MUSA (Murphy USA)|P/E Multiple MINISO Group Holding Limited MNSO|Mattel Corp - P/E Multiple|Business Payback Period L Brands BBWI|Restoration Hardware (RH) - Price to Earnings Ratio|investor.hayward.com - Company Value to Net Income|Price to Earnings Ratio ASO|SVV: Company Value to Net Income|P/E Multiple HLMN|Business Payback Period Once Upon A Child|Price to Earnings Ratio Upbound Group, Inc. UPBD|SBH: Price to Earnings Multiple|Olaplex - P/E Multiple|Latham Pool Products (SWIM) - Price to Earnings Ratio|ODP (OfficeMax) - Price to Earnings Ratio|YSG - Business Payback Period|Price to Earnings Ratio ARKO|Price to Earnings Ratio aihuishou.com (RERE)|Price to Earnings Ratio Helen of Troy (HELE)|EBF (Ennis Inc) - Company Value to Net Income|P/E Multiple ACCO (Mead)|Jakks (JAKK) - Market Cap to Earnings|ELA: Price to Earnings Ratio|grabagun.com - Market Price to Net Income Ratio|ACU: P/E Multiple|Clarus Corp. (CLAR) - P/E Multiple|SPWH (Sportsmans Warehouse) - P/E Multiple|1stdibs.com, Inc. (DIBS) - Business Payback Period|Price to Earnings Ratio Grove Collaborative (GROV)|Price to Earnings Ratio LESL (lesliespool.com)|MaxsMaking - Price to Earnings Ratio|Company Value to Net Income TBHC|CRWS - Price to Earnings Ratio|Market Cap to Net Income TKLF|ir.parkha.cn (PHH) - Price to Earnings Ratio|Aaron's - Company Value to Net Income|Price to Earnings Ratio Big Lots|Market Cap to Earnings Conn's HomePlus CONN|Price to Earnings Ratio Solo Brands, Inc. (DTC)|Price to Earnings Ratio 1847 Holdings Ltd EFSH|Kirkland's, Inc. - Price to Earnings Ratio|TCS - Price to Earnings Ratio|Tupperware - P/E Multiple|HIBB - P/E Multiple