WF Woori Bank: Accounting Value per Share

The equity per share chart for Woori Financial Group (WF) demonstrates that the metric has reached the 94.16 level. This price action reflects the stagnation of the Korean banking cycle and limited margins. The holding company relies on lending to the Asian industrial and logistics sectors. Meanwhile, fierce competition from digital services and market saturation create significant challenges for the long-term growth of asset values.

woorifg.com - analytical breakdowns and key metrics (WF)
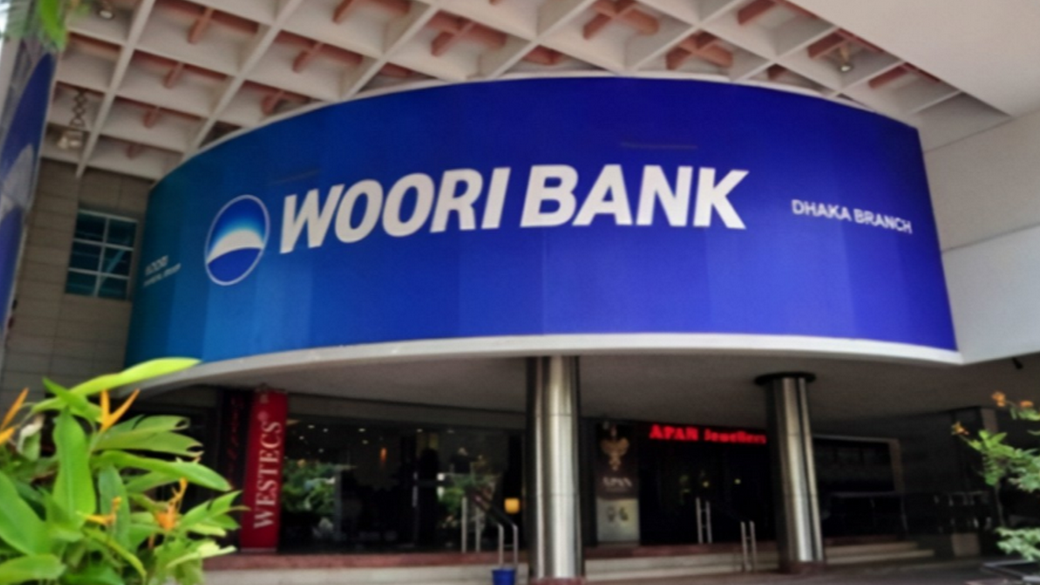
Stable demand for lending to South Korean conglomerates provides Woori Financial Group (WF) with high capital resilience. This metric is calculated as the ratio of equity minus intangible assets to the number of shares. By analyzing accounting data on share value, an investor determines the real asset value of the security without market noise. Horizontal trends here indicate stagnation in internal capital growth. The metric's dynamics confirm the fundamental reliability of the business.