WK Workiva Year-over-year earnings per share growth for the last twelve months

The history of quarterly earnings per share changes demonstrates the impact of ARR and high revenue retention on Workiva Inc. (WK) profitability, while the 623.60 level records fresh values. Demand for carbon footprint calculations within ESG frameworks is driving sales, and the deep integration of software into corporate compliance processes creates a robust defensive barrier for margins.

Workiva Platform - analytical breakdowns and key metrics (WK)
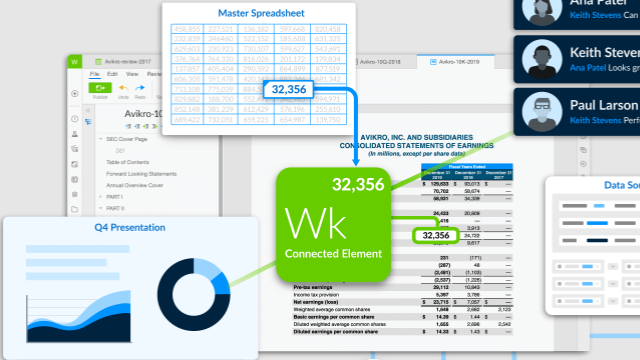
CFO confidence in Workiva Inc. (WK) ESG reporting standards ensures high resilience of its business model. This stability is reflected in the quarterly EPS chart. The metric measures the percentage change in net income per share relative to the previous period, revealing the scaling pace of profitability. Analyzing this indicator in conjunction with macroeconomics allows for the filtering of market noise, which is critical for determining the asset's fair value.
