World Kinect Corp (WKC) Price to Earnings Ratio

Corporate emblem and logo of World Kinect Corp (WKC)

World Kinect Corporation price action is driven by fuel price volatility and currency fluctuations. The market cap-to-earnings ratio clearly illustrates these trends, where the -10.80 mark reflects the latest data. Business stability relies on a global supply network, while the development of the ecosystem in ports and airports creates opportunities through the implementation of environmental services.

WKC World Kinect Corporation: P/E Multiple in the range 02/21/2024 - 11/11/2026
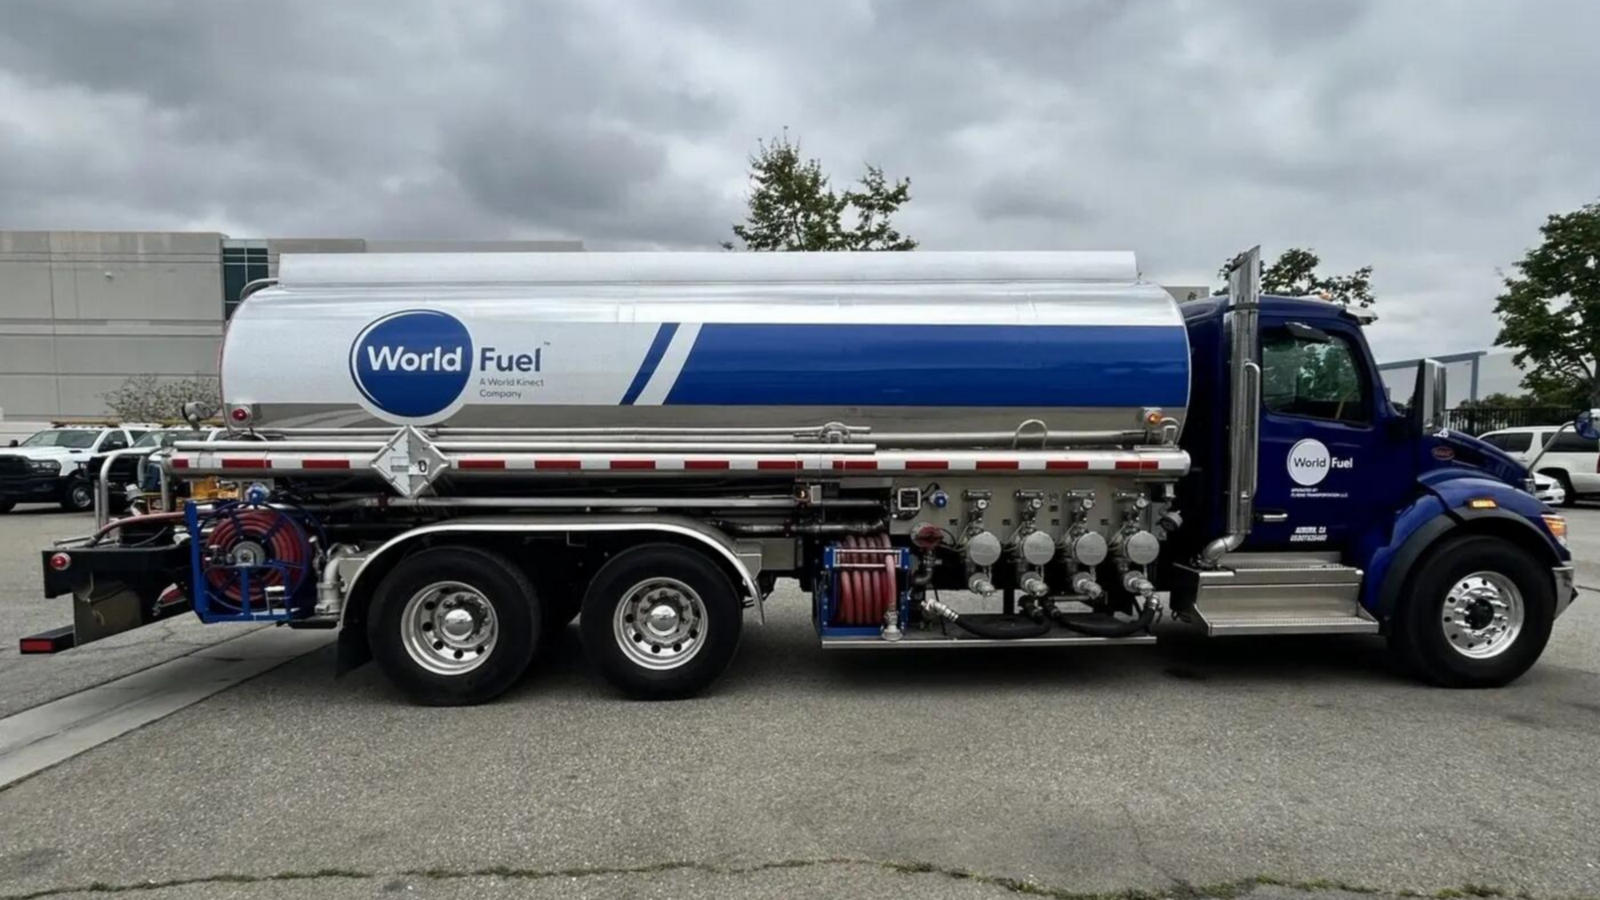
Manufactured product of World Kinect Corporation

The P/E ratio determines the market value of a single unit of profit, allowing an investor to assess the investment payback period relative to the business's current earnings. By analyzing the rolling P/E of World Kinect Corporation (WKC), one can understand how fuel price volatility and environmental risks impact market expectations, which helps balance capital protection with the asset's growth potential.

Competing companies

EPD: Company Value to Net Income|Price to Earnings Ratio Kinder Morgan (KMI)|Price to Earnings Ratio ET (Energy Transfer Partners)|Price to Earnings Ratio MPLX LP. MPLX|Cheniere Corp (LNG) - Market Cap to Earnings|ONEOK, Inc. - P/E Multiple|Market Cap to Net Income Ratio targaresources.com (TRGP)|CQP: P/E Multiple|PBA - Business Payback Period|Price to Earnings Ratio Plains All American Pipeline LP|DT Midstream Corp (DTM) - Business Payback Period|Price to Earnings Ratio AM (Antero Midstream)|Market Price to Net Income Ratio HESM|Sunoco - Price to Earnings Ratio|KNTK - Price to Earnings Ratio|SOBO - Price to Earnings Ratio|Market Cap to Earnings Frontline Corp|Golar LNG Limited (GLNG) - Price to Earnings Ratio|scorpiotankers.com - Company Value to Net Income|Price to Earnings Ratio Delek Logistics Partners, LP|Price to Earnings Ratio INSW|P/E Multiple DHT|Genesis Energy Partners - Price to Earnings Multiple|Teekay Tankers Ltd. - Price to Earnings Ratio|Company Value to Net Income GLP|TGS - Price to Earnings Ratio|LPG - P/E Multiple|FLNG: P/E Multiple|CCEC - Business Payback Period|Price to Earnings Ratio Navigator Holdings Ltd.|Price to Earnings Multiple ECO (okeanisecotankers.com)|P/E Multiple CAPL|NAT - Market Cap to Earnings|P/E Multiple CLCO (Cool Company Ltd)|KNOP - Price to Earnings Ratio|GASS: Price to Earnings Ratio|imperialpetro.com - Market Price to Net Income Ratio|DLNG (dynagaspartners.com) - Price to Earnings Ratio|Stabilis Solutions Inc. - Company Value to Net Income|DLXY (Delixy Holdings Limited) - P/E Multiple|Price to Earnings Ratio Rubico Corp (RUBI)|Price to Earnings Ratio Brooge Energy Limited (BROG)|ENLC - Market Cap to Earnings|Price to Earnings Ratio Robin Energy RBNEV