AKAN: מכפיל P/S Akanda Corporation

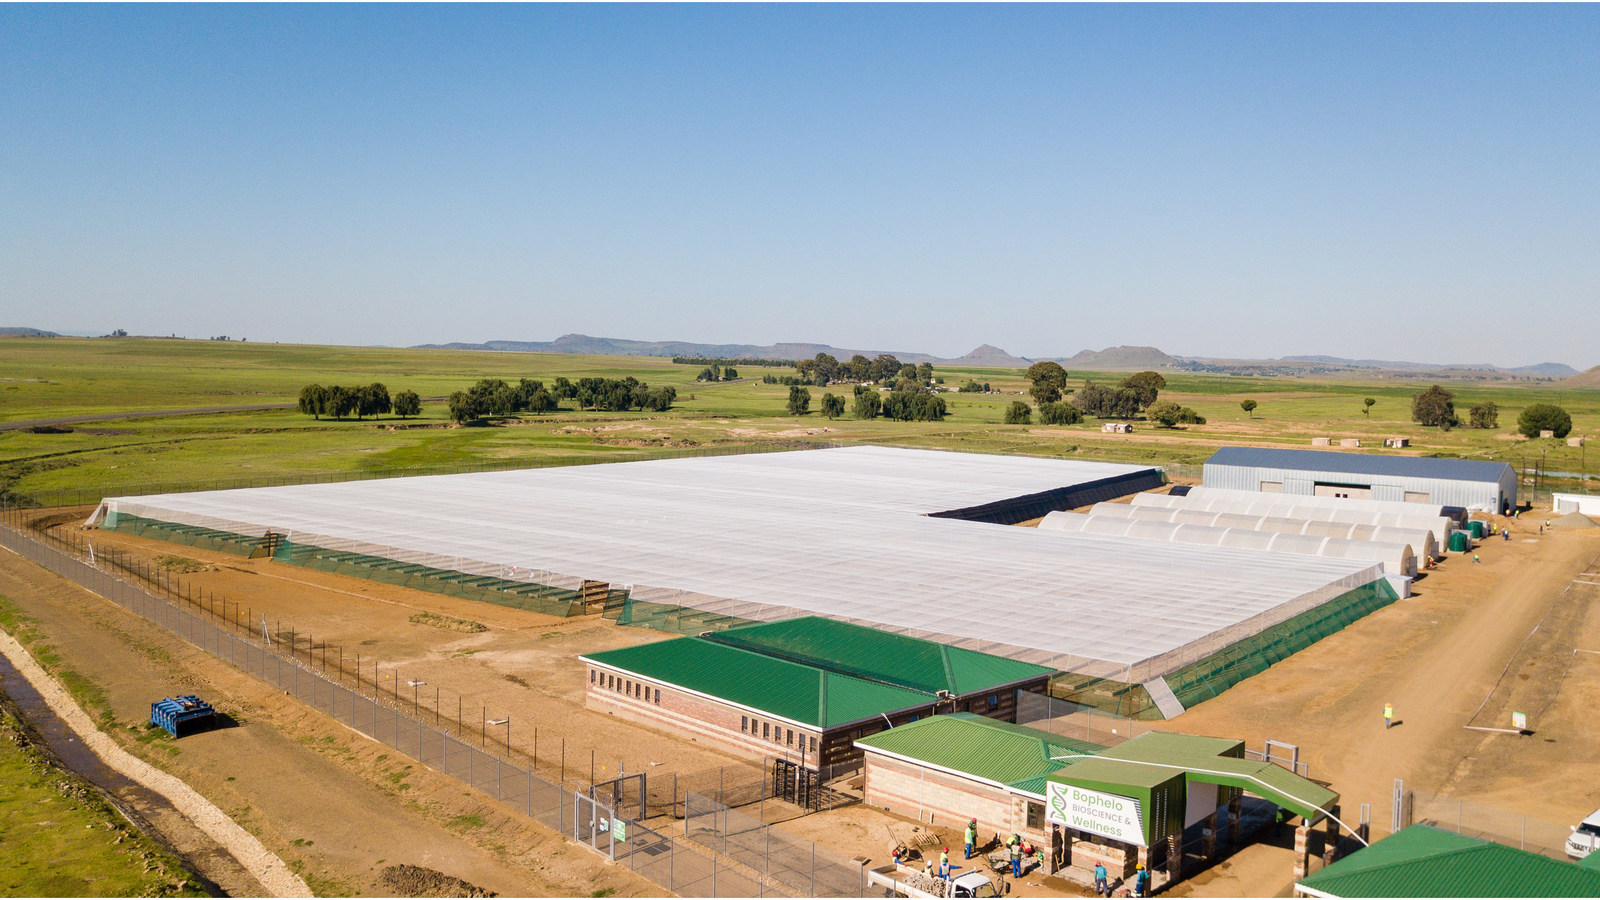
Akanda is overcoming a prolonged downturn in the European medical cannabis sector through asset optimization. This P/S chart visualizes this stage, where the metric stands at 2.70. AI-driven greenhouse automation is driving efficiency gains, while a global presence across Africa and Europe minimizes regional risks. The multiplier's dynamics help determine the entry point into the asset.

פילוחים אנליטיים של חברת Akanda Corporation (AKAN)
The selection of high-quality issuers is based on comparing market capitalization with actual sales volumes, which allows for the identification of undervalued assets. This multiple measures the cost per unit of revenue to help determine if a stock is overbought, while the fact that Akanda (AKAN) operates exclusively within the US domestic market minimizes external risks, making the historical P/S a reliable tool for assessing the business's fundamental stability.
