Halcón Resources (BATL) - מכפיל מחיר לרווח

The PE ratio chart for Battalion Oil (BATL) demonstrates figures at -0.50 during a period of commodity stabilization, where balanced demand protects cash flows. The business is based on the operation of wells in Texas utilizing pressure control automation. Meanwhile, the company is resisting takeovers by corporate behemoths, fighting for access to services and plot leases amid price instability.

פילוחים אנליטיים של חברת Battalion Oil
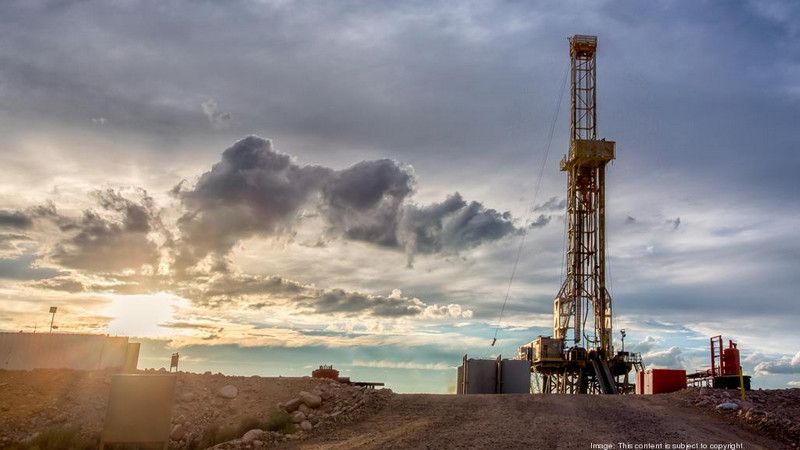
This multiple reflects the market value of a single unit of profit, allowing the investor to assess the degree of overpayment for the asset through the continuous comparison of quotes and actual earnings. An analysis of the annual P/E of Battalion Oil (BATL) helps determine the effectiveness of management's strategy to optimize costs in the Delaware Basin and evaluate the extent to which current market capitalization aligns with oil production growth rates.
