CleanSpark Mining - רווח נקי למניה (EPS TTM) CLSK

Amidst the fierce competition for cheap electricity and pressure from major mining pools, BTC mining is evolving into an arms race. The year-over-year (TTM) EPS change on the GURU.Markets platform chart reflects profit dynamics, where the value has stabilized at -470.40. CleanSpark, Inc. (CLSK) efficiency is based on upgrading its ASIC fleet and maintaining low coin production costs, enabling the company to aggressively capture market share.

CleanSpark Mining - פילוחים אנליטיים ומדדי מפתח (CLSK)
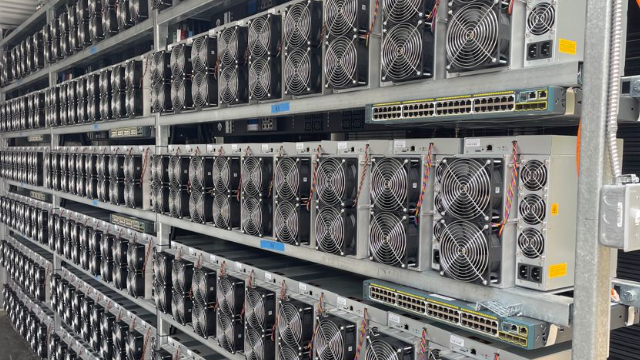
Year-over-year (YoY) EPS growth (TTM) reflects the percentage change in net income per share over the last four quarters relative to the same period last year, allowing for an assessment of business scaling rates. By analyzing the 12-month EPS YoY history, an investor can identify the earnings instability of CleanSpark, Inc. (CLSK) driven by Bitcoin price volatility and high energy and equipment costs.
