OI: שווי שוק לרווח נקי מותאם קצב צמיחה o-i.com

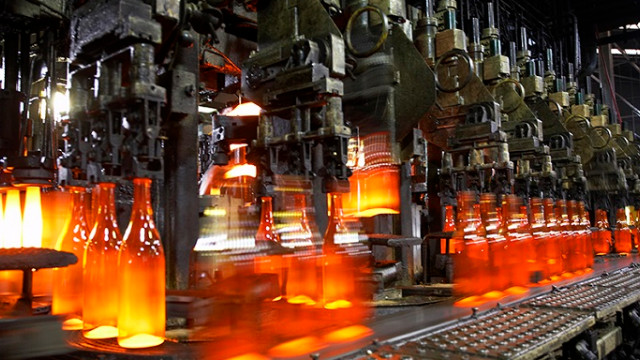
The O-I Glass, Inc. (OI) business model relies on the production of glass containers, creating a dependency on energy costs and demand from winemakers. However, its status as a global leader and the eco-friendly nature of its products ensure stable long-term interest. Competent management is effectively optimizing expenses and restructuring plants. The growth-adjusted P/E ratio demonstrates value dynamics relative to earnings, and this metric equals 0.00.

פילוחים אנליטיים של חברת O-I Glass, Inc. (OI)
For O-I Glass, Inc. (OI), a leader in glass packaging production for global B2B brands, the PEG ratio serves as a tool to compare market value with earnings dynamics. This metric is calculated by dividing the P/E multiple by the earnings growth rate: a value below one indicates that the asset is undervalued relative to its expansion, signaling potential for outperforming price growth.
