Radian Group Inc. (RDN): מחיר לרווח עתידי

The high barrier to entry in mortgage insurance is driven by stringent government oversight and capital requirements. Radian Group Inc. (RDN) revenues are based on home values, employment levels, and new policy volumes. The company's forward P/E ratio reflects the current market valuation, where the metric stands at 7.00, complemented by a stable staff of high-caliber actuaries and risk modelers.

פילוחי מדדים ואנליטיקה של חברת radian.com (RDN)
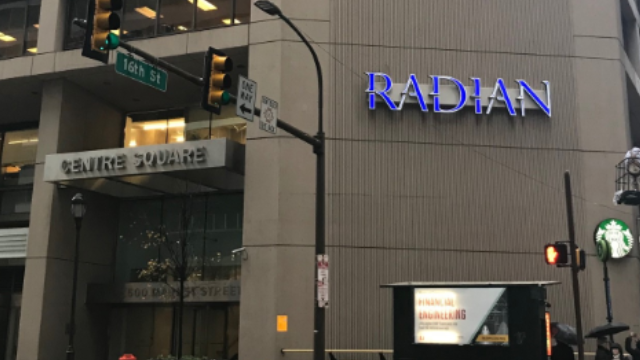
To identify fundamental leaders, the analyst evaluates the ratio of market capitalization to expected annual earnings, which determines the extent of the asset's overvaluation. The trend of the projected P/E ratio for Radian Group Inc. (RDN) reflects the market consensus regarding the company's stability as a mortgage risk guarantor, where a declining line indicates rising operational threats or a discount to institutional confidence.
