Reliance Inc (RS) - מכפיל P/E

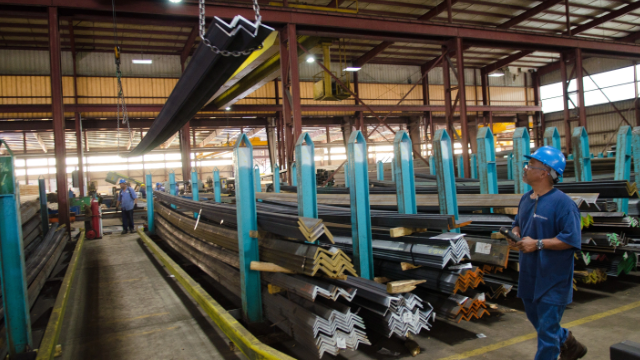
Reliance, Inc. (RS) generates revenue by reselling steel and aluminum to North American contractors. The P/E market valuation on the GURU.Markets terminal linear chart reflects price action where the value 19.30 represents the current metric. Stable income is driven by sophisticated B2B procurement logistics, while business resilience is bolstered by the regular upgrading of equipment at high-precision cutting service centers.

פילוחי מדדים מקיפים ואנליטיקה עבור Reliance Steel & Aluminum (RS)
A conservative investor is assessing the fundamental value of Reliance, Inc. (RS) to determine the extent of the asset's overvaluation. The P/E ratio compares current market capitalization with net income, measuring the payback period of the investment through business profitability. By analyzing the P/E trajectory of Reliance, Inc. (RS), one can identify market overheating amid moderate automation and a lack of radical technological breakthroughs. This allows for a balance of entry risks given the restrained innovation activity.
