רווח נקי למניה (EPS TTM) SilverBow Resources, Inc. (SBOW)

The net income per share over the last 12 months reflects the impact of price volatility and the competition for resources in the Permian Basin, with the indicator standing at 7.89. SilverBow Resources (SBOW) generates revenue from hydrocarbon extraction in Texas, targeting LNG demand. The company's current development stage involves the full merger of its assets and capacities with a major operator.

פילוחים אנליטיים ודוחות נתונים של חברת SilverBow Resources Inc. (SBOW)
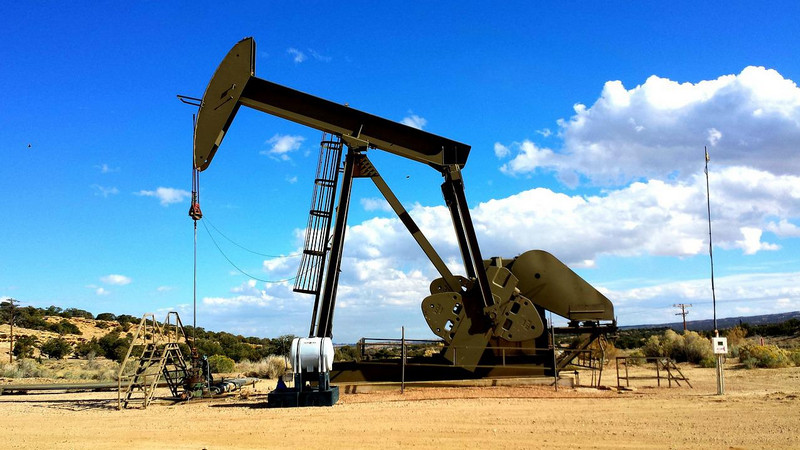
This indicator measures the real capital generation efficiency per security over a rolling year for SilverBow Resources (SBOW). The calculation excludes the impact of issuance changes, allowing for an assessment of net yield without distortions from equity dilution. By analyzing the company's annual net profit per share, an investor determines the business's resilience to market volatility. The trend line reflects the financial results from the operation of shale assets. Current profit growth is supported by the implementation of external AI modeling systems instead of costly proprietary developments.
