SLCA: יחס מחיר שוק לרווח נקי U.S. Silica Holdings Inc.

The price trend visualization on GURU.Markets for U.S. Silica Holdings (SLCA) demonstrates an individual P/E ratio of 10.40. Business profitability relies on global political stability, as sanctions and conflicts erode raw material export margins. Growth is driven by the demand for silica sand for solar energy and hydraulic fracturing. U.S. Silica Holdings (SLCA) is expanding its distribution by supplying materials for ceramics and specialty glass.

פילוחים אנליטיים של חברת ussilica.com (SLCA)
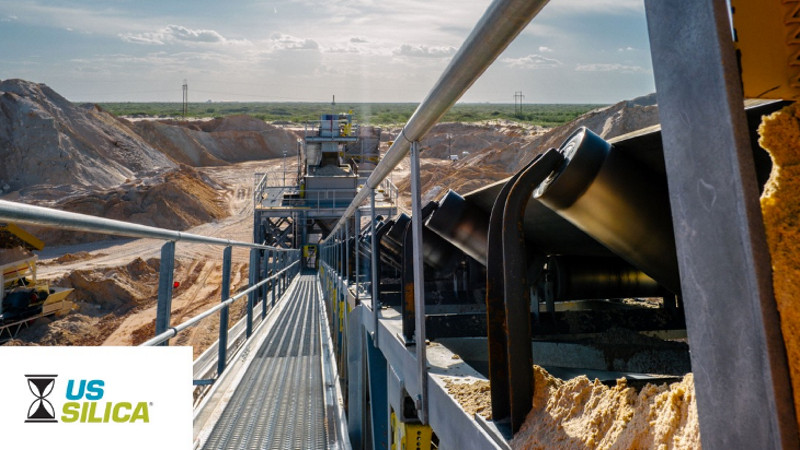
The cyclicality of quartz sand mining for the shale sector directly determines the dynamics of the P/E valuation ratio for U.S. Silica Holdings (SLCA). This multiple compares the current share price to net income, measuring the investment payback period. The calculation is based on the ratio of market capitalization to annual earnings, identifying whether the asset is overbought or undervalued. High fixed costs at U.S. Silica Holdings (SLCA) make this indicator sensitive to drilling volumes. It is critical for investors to distinguish fundamental growth from temporary earnings spikes.
