syndax.com - קפיטליזציית שוק SNDX
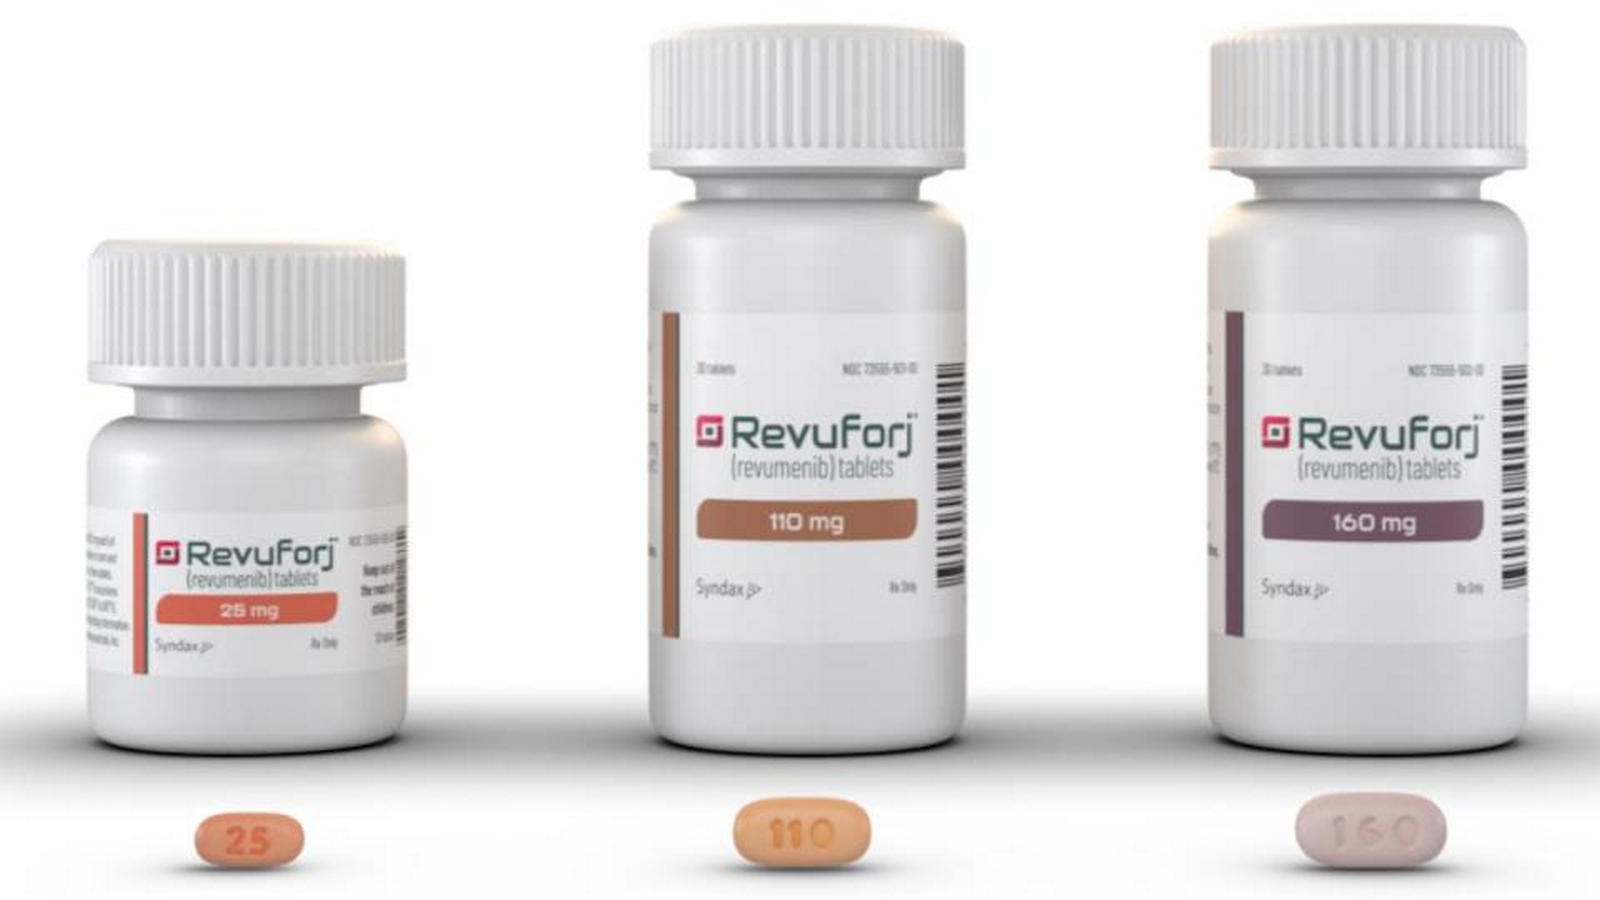
The price chart for Syndax Pharmaceuticals (SNDX) illustrates the asset's dynamics, the success of which is tied to the implementation of revumenib for leukemia and the level of 1.17. High synthesis costs and stringent FDA requirements create insurmountable barriers to entry for new players. Growth prospects rely on the market launch of Niktimvo, the search for new applications for leukemia therapy, and potential mergers with industry behemoths.

פילוחי מדדים ואנליטיקה של חברת Syndax Corp (SNDX)
The total market capitalization of Syndax Pharmaceuticals (SNDX) reflects the market valuation of its oncology pipeline and licensing streams, calculated as the product of the current share price and the number of outstanding shares. The trend of this metric allows investors to determine capital stability amid tight monetary policy, assessing the business's ability to maintain a minimum reliability threshold during periods of reduced market liquidity.