Sovos Brands Corp - דינמיקת הכנסות משנה לשנה ב-12 החודשים האחרונים SOVO
Acquisition by a global behemoth has strengthened the position of Sovos Brands, Inc. (SOVO), as evidenced by the 12-month YoY sales growth chart. This metric stands at 23.30. While business stability is underpinned by plant automation in the US and Italy, geopolitical disruptions in the agricultural and logistics sectors are forcing the company to pass costs onto consumers to offset inflationary pressures.

Sovos (SOVO) - פילוחי מדדים ודוחות פיננסיים
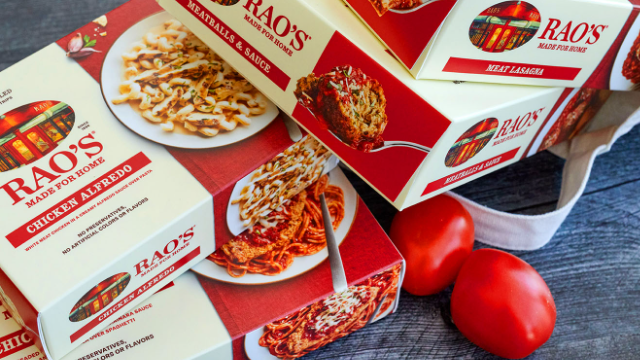
The stability of Sovos Brands, Inc. (SOVO) refrigerated transport supply chains directly determines the availability of premium sauces on shelves, impacting product turnover rates. By analyzing this trailing twelve-month (TTM) revenue change chart, an investor can track daily sales growth dynamics, allowing for a seamless assessment of business acceleration without quarterly gaps and helping to avoid overpaying for the asset at its peak or freezing capital at the bottom.
