SUNE: מזומנים בחישוב למניה אחת SUNation Solar

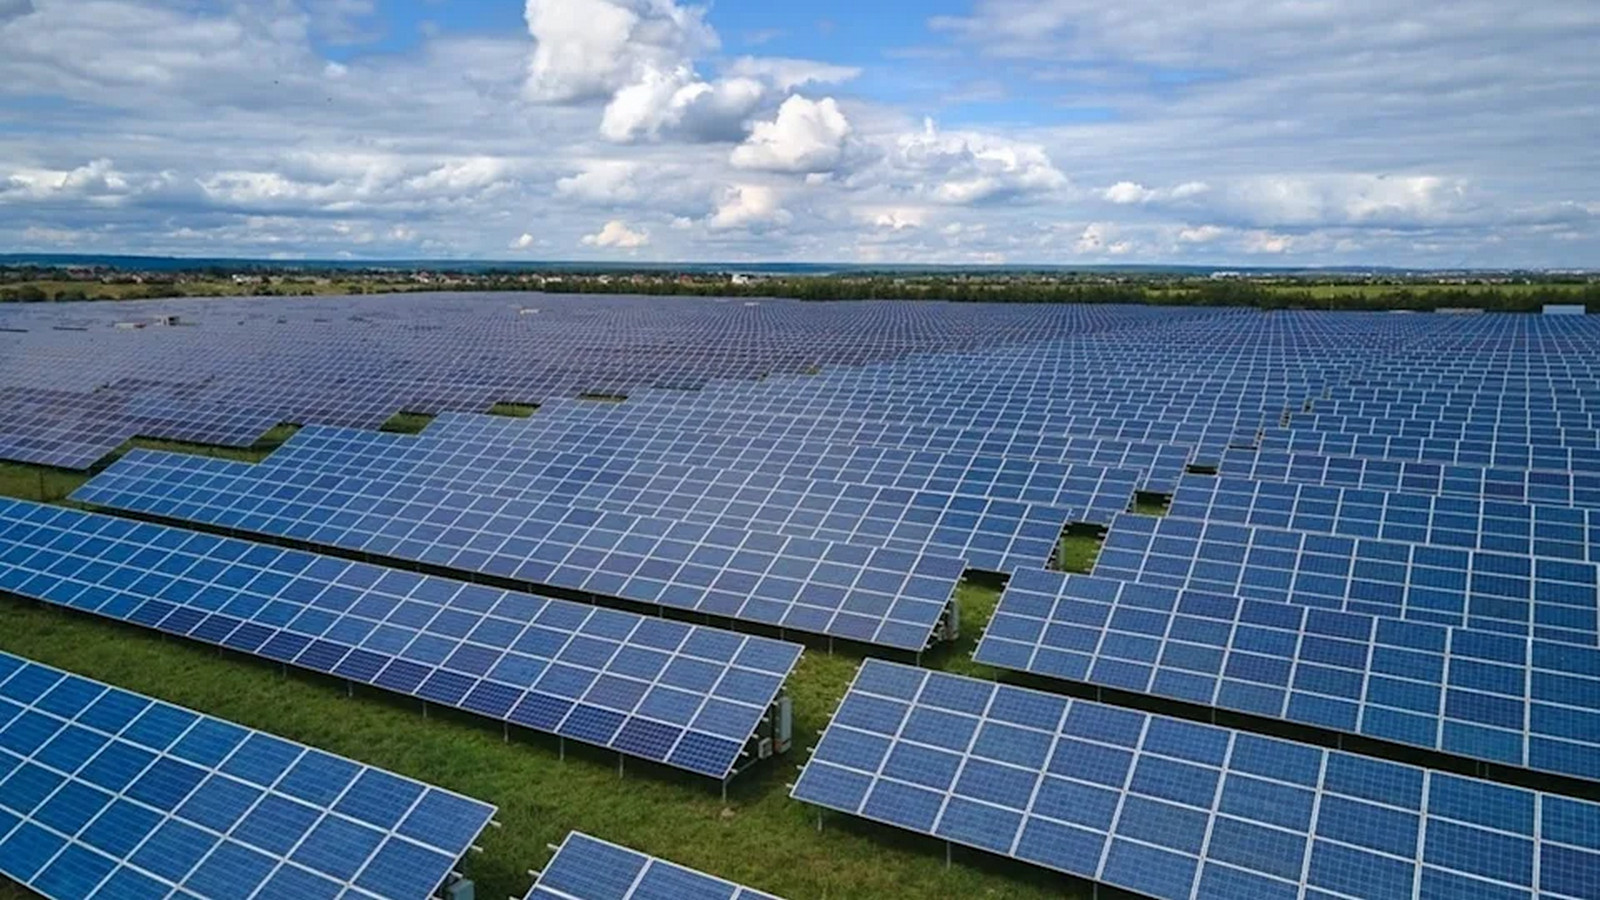
SUNation Energy Inc (SUNE) is developing an ESG strategy by creating large-scale solar power plants and optimizing the environmental efficiency of its transport. The cash per share history on the GURU.Markets time chart reflects liquidity dynamics, where the 0.47 parameter determines the metric's value. Regional warehouses simplify panel installation and reduce costs, although rising interest rates and tariff adjustments in New York are weighing on margins.

פילוחים אנליטיים של חברת SUNation Energy (SUNE)
For SUNation Energy Inc (SUNE), the cash per share ratio reflects the business's internal capacity for self-financing. This metric is calculated by dividing total cash and cash equivalents by the number of outstanding securities. It measures the liquid reserve available to cover operating expenses without resorting to debt. Within the fragmented solar energy market, this capital is utilized to subsidize customer loans. A decline in this indicator signals a risk of resource depletion due to the company's low pricing power.
