יחס מחיר לרווח Treace Medical Concepts Inc (TMCI)

The Treace Medical Concepts (TMCI) price chart illustrates the P/E multiple dynamics, which currently stand at -5.80, correlating directly with the adoption rates of innovative methodologies and insurance reimbursement conditions. The brand is recognized as the benchmark in bunion correction due to its proprietary 3D approach. FDA protection and high loyalty among surgeons who have transitioned to new surgical standards guarantee a steady client flow and the absence of low-cost substitutes.

פילוחי מדדים מקיפים ואנליטיקה עבור Treace Medical (TMCI)
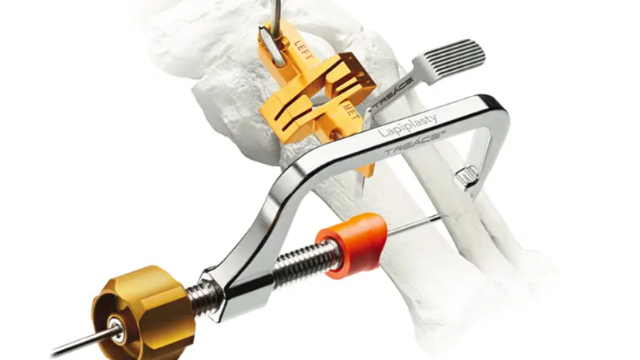
Investors are assessing the potential of Treace Medical Concepts (TMCI) through the lens of the price-to-earnings ratio. This multiple determines the price of a single unit of income, making it possible to identify whether the asset is overvalued relative to its actual profit generation. By analyzing the historical P/E range of Treace Medical Concepts (TMCI), one can understand the extent to which patent protection and proprietary operational protocols convert into sustainable capitalization growth. This helps distinguish the fundamental value of the business from speculative optimism.
