tphs.com (TPHS): יחס חוב לטווח קצר להון עצמי

The price chart for Trinity Place Holdings (TPHS) on GURU.Markets helps assess the efficiency of capital management derived from the company's luxury New York properties, where the indicator stands at 0.00. High construction material costs and credit risks are undermining yields. While the business relies on a pool of premium tenants, demand volatility and strict municipal controls are hindering the network's expansion.

פילוחים אנליטיים של חברת tphs.com (TPHS)
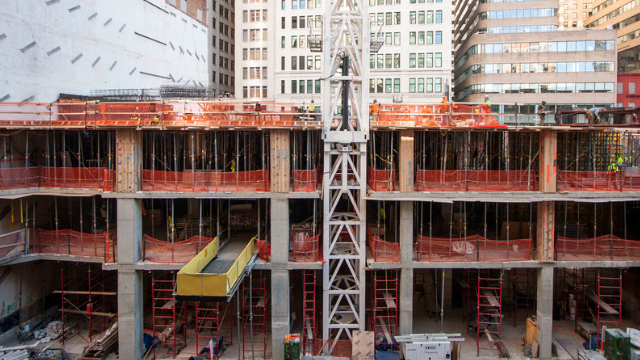
This indicator measures the proportion of liabilities maturing within one year relative to equity, allowing investors to assess the risk of an immediate liquidity crunch as debt loads increase. Analyzing the short-term leverage history of Trinity Place Holdings (TPHS) reveals how cash flow gaps resulting from the maintenance of New York properties force the business to deplete reserves to service current loans.