TSSI Total Site Solutions: מקדם חוב לטווח ארוך להון
The TSS, Inc. (TSSI) price chart reflects the dynamics of a company that modernizes IT environments and data centers to optimize the digital movement of goods. The current indicator is 0.40. The business leverages excess cash resulting from a sharp increase in demand for AI capacity. Furthermore, the firm is implementing energy-efficient server cooling systems, helping partners reduce harmful emissions and electricity costs.

פילוחי מדדים ואנליטיקה של חברת TSS, Inc. (TSSI)
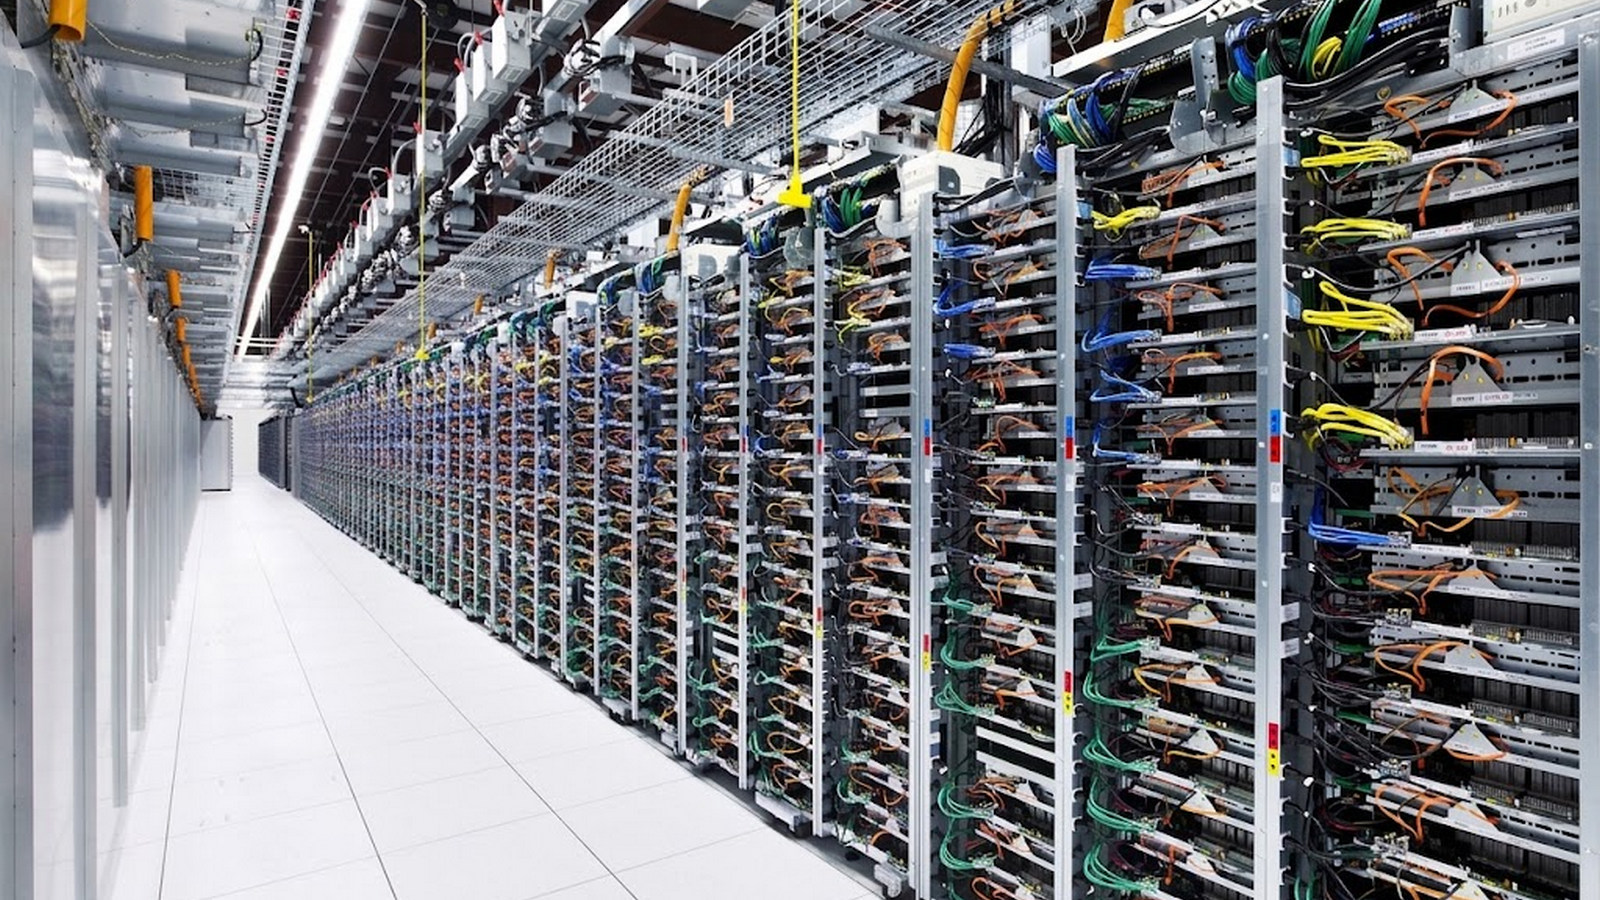
When selecting assets with a high margin of safety, it is critical to evaluate the long-term debt-to-equity ratio, which determines a business's reliance on external financing over a horizon of more than one year. By analyzing the history of the long-term debt-to-equity ratio, an investor can determine how effectively TSS, Inc. (TSSI) balances the use of leverage for expansion into AI infrastructure with financial stability during the acquisition of engineering firms.