cnoinc.com (CNO): Nilai perusahaan marang bathi sadurunge bunga, pajeg, lan panyusutan

Predictable cash flows from insurance premiums create a liquidity base, and this chart on GURU.Markets reflects the EV/EBITDA trajectory for CNO Financial Group (CNO), where the 0.00 indicator expresses the state of the metric. Growth is driven by the aging US population and high interest rates, while the strategy relies on expanding the agency network without pursuing M&A transactions.

Ringkesan rincian data analitis cnoinc.com (CNO)
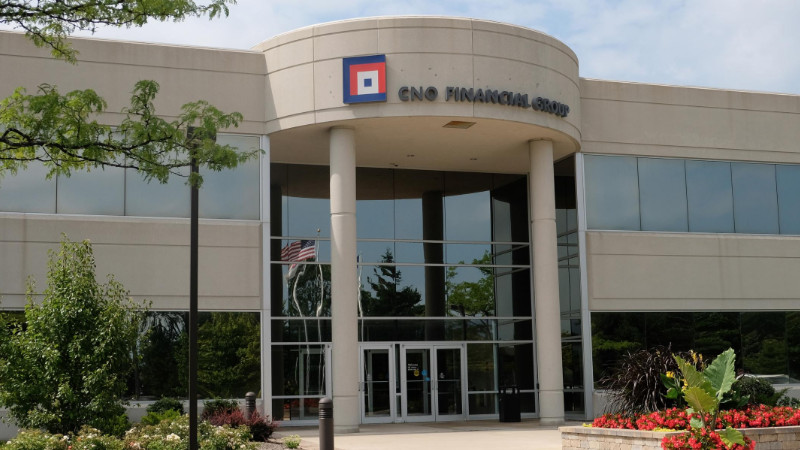
Utilizing this ratio minimizes the risks of misvaluing CNO Financial Group (CNO) by separating market noise from actual operational efficiency. This is critical for an insurance business with digital underwriting, as it allows for the comparison of the entire enterprise value against earnings before interest, taxes, depreciation, and amortization. By analyzing the EV/EBITDA value of CNO Financial Group on the chart, an investor sees the real price of the asset adjusted for debt load.
