FCEL FuelCell Energy Inc: Bathi saben saham sajroning taun lumaku

Serving as a valuation tool, the FuelCell Energy, Inc. (FCEL) EPS (TTM) chart on the GURU.Markets platform recorded a value of 62.70. The business develops stationary clean energy systems, leveraging exclusive patents and long-term contracts. Expansion potential depends on production limits and raw material costs, while profits grow through the serial production of modules. Demand is supported by the global industrial decarbonization trend.

Rincian metrik keuangan lan pasar FuelCell Energy Corp (FCEL)
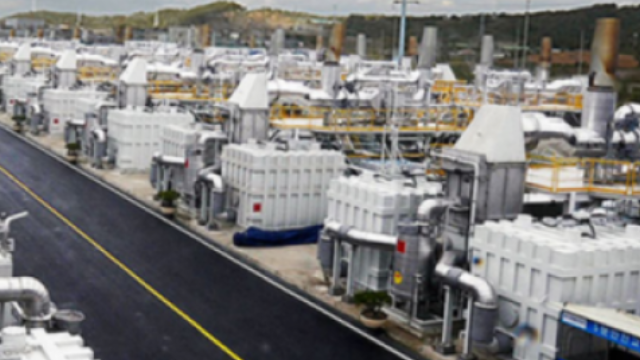
This indicator calculates the percentage change in net income per share over a rolling year, reflecting the rate of real capital generation. This metric allows for the rapid tracking of deviations in the asset's fundamental value from the investor's long-term goals. For FuelCell Energy, Inc. (FCEL), this calculation is critical, as the market demands that management accelerate the payback period for hydrogen projects. By analyzing the annual shift in EPS TTM, one can assess the effectiveness of the company's commercial strategy adaptation.
