GIS - Wutah dodolan taun lumaku General Mills, Inc.
Year-over-year comparable sales growth over 12 months depends on inflationary pressure and the cost of agricultural raw materials. Extensive global plants and warehouses, along with low-cost overland shipping for shelf-stable goods, ensure stability. The current mark -4.50 captures this metric, allowing for a real-time assessment of the commercial success of General Mills, Inc. (GIS) without accounting distortions.

generalmills.com (GIS) - rincian metrik lan laporan keuangan
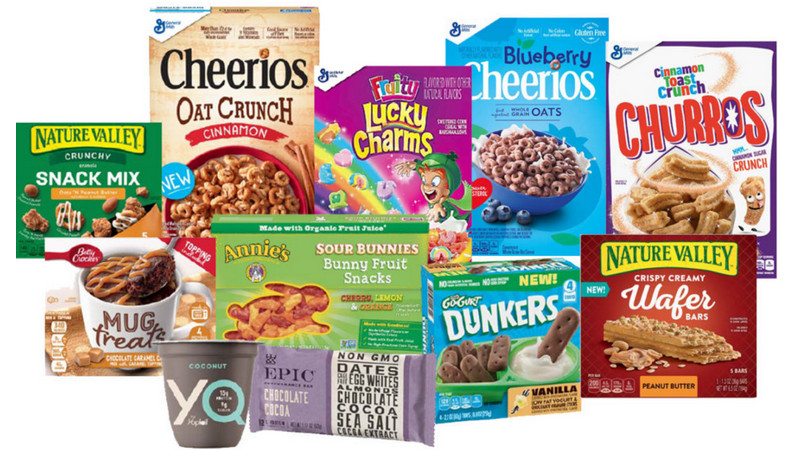
For General Mills, Inc. (GIS), year-over-year sales growth (TTM) serves as an indicator of the ability of its brands, including Blue Buffalo, to generate organic volume and leverage pricing power against inflation. Revenue dynamics over a trailing 12-month period allow for an assessment of the resilience of fundamental growth rates; however, investors should keep in mind that even an upward trend may mask stagnation in real demand.
