SENEA (Seneca Foods Corp.) Bathi resik saben saham (EPS TTM)
The TTM earnings per share chart demonstrates the synergy of Seneca Foods (SENEA) with agricultural cooperatives and retailers through the production of private label brands. Meanwhile, 17.26 reflects the latest metric value against a backdrop of conservative R&D focused solely on plant automation. Earnings growth is constrained by low scalability due to a heavy dependence on seasonal harvests and the costly logistics of canned goods production.

Rincian analitis lan laporan data perusahaan Seneca Foods Corp (SENEA)
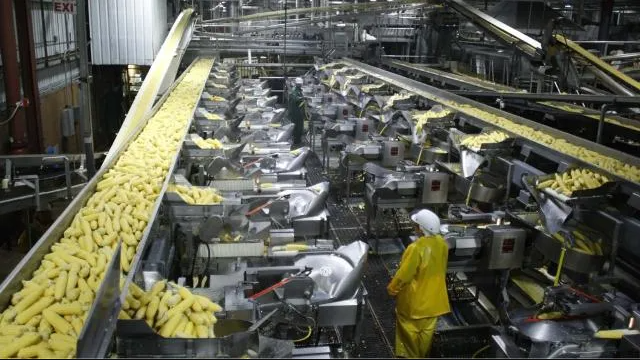
The optimization of farming supply chains and plant automation at Seneca Foods (SENEA) directly impacts the bottom-line net income, which, when divided by the total number of shares, determines the earnings per share. The current value of 17.26 reflects the real-time efficiency of the business transformation, while the change in earnings per share over the last 12 months allows investors to track the company's fundamental performance regardless of the impact of share issuance volume.
