ABBV: AbbVie Inc Company Value to Net Income

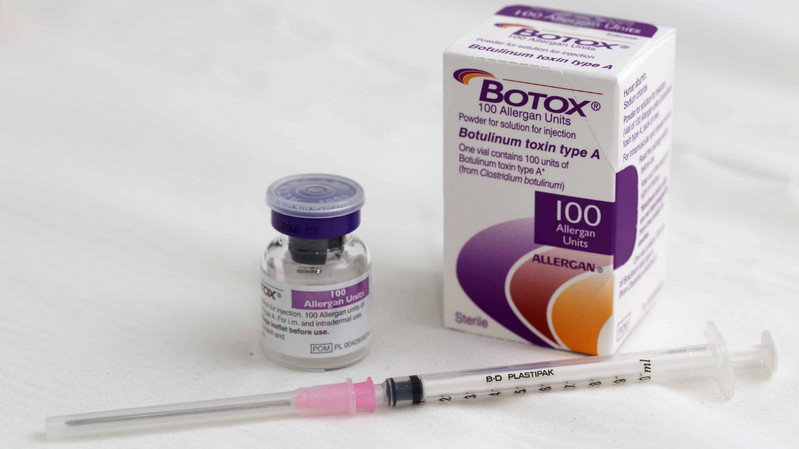
AbbVie Inc. (ABBV) is a reliable pharmaceutical holding with high-quality earnings and stable FCF, and on GURU.Markets, this linear chart of its market cap-to-earnings valuation reaches 50.80. The business's resilience is based on diversification into aesthetics and neurology, while the inertial flow from immunology is successfully supplemented by new developments, preventing the company's financial metrics from fading.

Comprehensive metric breakdowns and analytics for AbbVie (ABBV)
The P/E ratio reflects the market value of a single unit of net profit, determining the extent to which an asset is overvalued or undervalued. The historical P/E values for AbbVie Inc. (ABBV) on the GURU.Markets platform allow for an assessment of the stock's resilience to market shocks. The ratio is calculated by dividing the current share price by the annual earnings per share. For AbbVie Inc. (ABBV), this indicator confirms the effective monetization of long-term patents and the stability of cash flows from chronic disease treatments.
